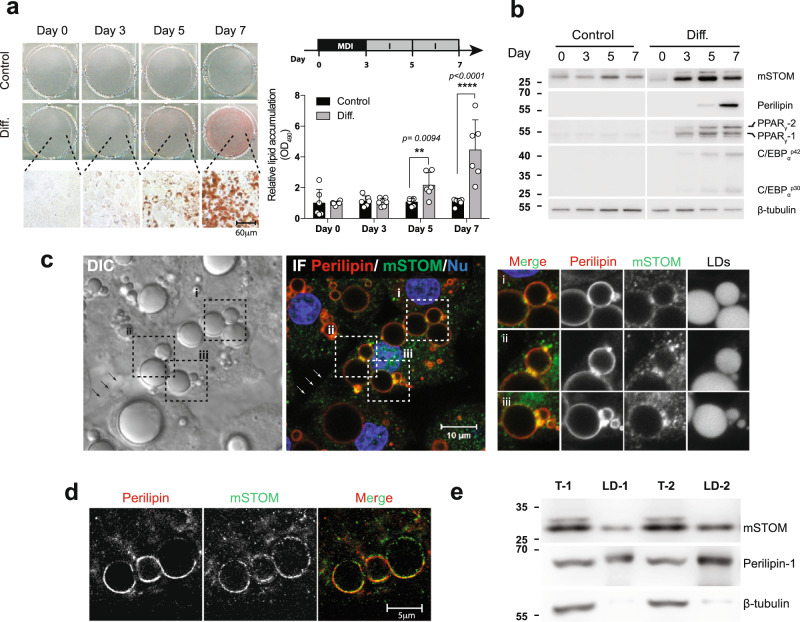
Fig. 1. Stomatin expressions increased during adipogenesis.
a Mouse 3T3-L1 fibroblasts were treated with MDI induction medium (Diff.) or control vehicle. On Day 0, 3, 5, 7 after induction, cells were stained with Oil Red O and observed under microscopy. Bar = 60 µm. The amounts of lipid accumulation for individual culture plates were quantified by measuring absorbance at 490 nm (OD490). Mean ± s.d. for six independent experiments. **P < 0.01 and ****P < 0.0001 by two-way ANOVA analysis. b On the day after induction as indicated, Western blotting analyses revealed increased expressions of endogenous mouse stomatin (mSTOM), perilipin, PPARγ and C/EBPα. c Subcellular distributions of stomatin and perilipin in Day 7 adipocyte-like cells were observed by differential interference contrast (DIC) and immunofluorescence (IF) microscopy using a confocal microscope. Cell nuclei (Nu) were revealed by Hoechst stain. Stomatin proteins were present on the plasma membranes (arrows) and surfaces of lipid droplet (LD) (inset i-iii). Bar = 10 µm. d STED microscopy showed that stomatin and perilipin were partially colocalized on the LD surfaces. Scale bar = 5 µm. e LDs were isolated and subjected to immunoblotting analyses. Stomatin and perilipin proteins, but not β-tubulin, were identified in the LD fractions (LD-1 & LD-2). Source data are provided as a Source data file. STED: stimulated emission depletion; T-1 & T-2: total cell lysates.

