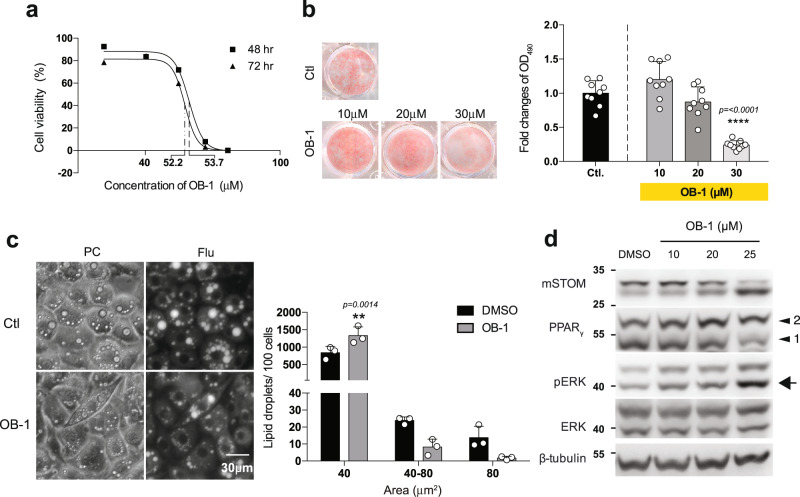
Fig. 8. Stomatin inhibitor OB-1 inhibited adipogenesis and hindered lipid droplet growth.
a Cell viability after OB-1 treatments for 48 h or 72 h were tested by MTT assays. LC50 for OB-1 were tested from three independent experiments. b Cultured plates of adipocyte-like cells were treated with or without OB-1 at concentrations indicated, stained with Oil Red O and subjected to OD490 quantifications. Note OB-1 inhibited adipogenesis in a dose-dependent manner, compared to the control DMSO treatment. Each OB-1 treatment data was normalized to the corresponding DMSO vehicle control; fold changes are shown. Mean ± s.d. for three independent experiments (n = 3 for each experiment). ****P < 0.0001 by one-way ANOVA. c Adipocyte-like 3T3-L1 cells after 7-day induction were treated with 25 µM OB-1 or control vehicle; LDs of these cells were labeled by AdipoRed. The numbers and sizes of LDs were determined. Histogram analyses showed more small LDs (<40 µm2) and less large LDs (>80 µm2) after OB-1 treatments, compared to the control. Mean ± s.d. for three independent experiments. **P < 0.01 by two-way ANOVA. Bar = 30 µm. d Treating adipocyte-like cells with stomatin inhibitor OB-1 also resulted in activation of ERK pathway, evidenced by increased pERK (arrow). Source data are provided as a Source data file.

