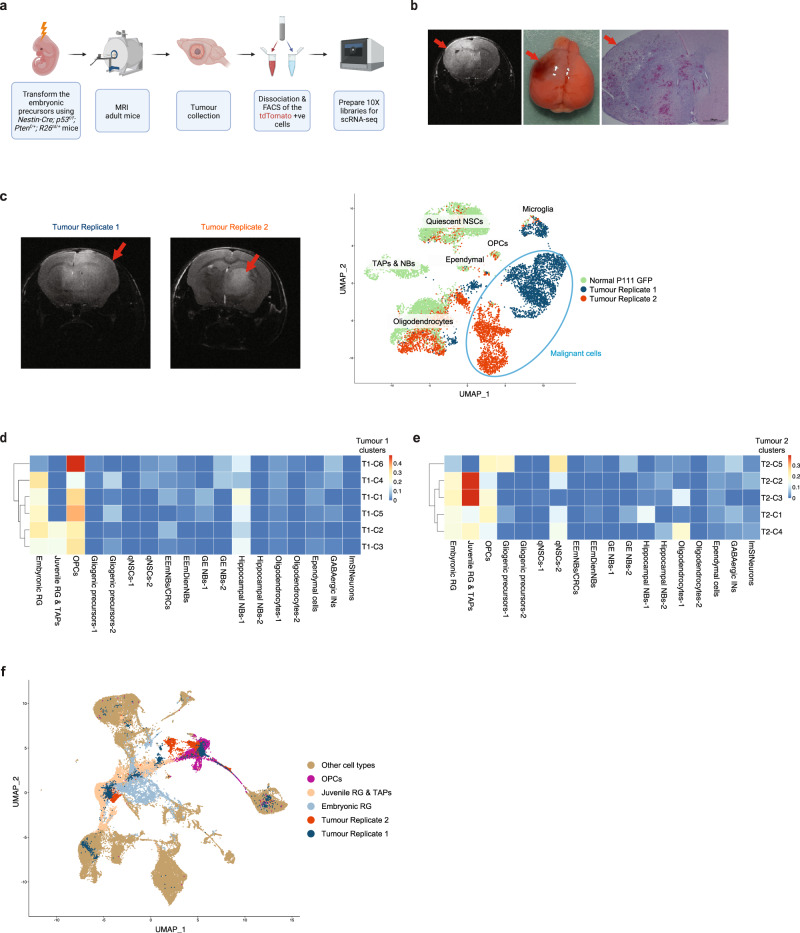
Fig. 7. Transformation of the prenatal mouse cerebral precursors gives rise to adult cerebral tumours that show an embryonic/juvenile RGP identity.
a Schematic overview of the experimental workflow. b, MRI of a mutant mouse brain at 16 weeks of age showing a tumour encompassing the left hemisphere (red arrows) with an image of the brain after dissection and an H&E-stained section. The brain was collected 30 min after the MRI. Scale bar, 100 µm. c Left: mouse brain MRI from two tumour replicates, the scans were performed 30 min before brain sample collection. Shown on the right is the UMAP clustering of single-cell transcriptomes from the two mouse tumour replicates and the GFP+ cells from the P111 timepoint in the developmental atlas. d, e Deconvolution analysis heatmap of the malignant clusters from tumour replicate 1 (d) and tumour replicate 2 (e), showing relative fraction of the mouse developmental cell-types for each tumour cluster (see Methods). The malignant cells from each tumour replicate were clustered separately (see Supplementary Fig. 10b, c and Methods) and the clusters are denoted as e.g., “Tumour-replicate#1 cluster#1” = “T1-C1”. f Co-clustering of the cells from the two tumour replicates with the clusters from the mouse developmental dataset (see Methods). Abbreviations as in Fig. 4.

