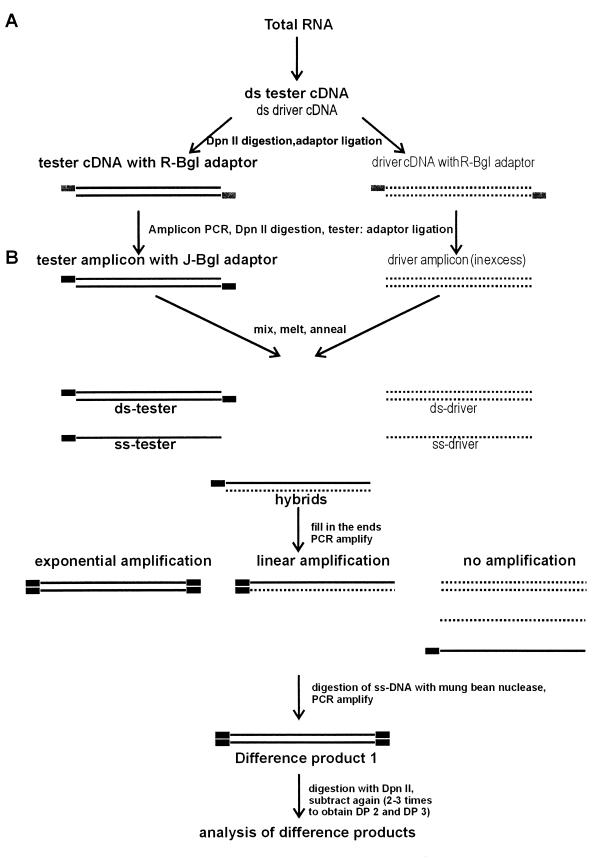
FIG. 1.
Schematic illustration of the micro-RDA protocol. Broken lines represent the driver population, and solid lines represent the tester fraction. Small solid boxes symbolize the Bgl adapter series. This diagram illustrates cDNA synthesis, amplicon synthesis (A), and the synthesis of DP 1 via subtractive hybridization and selective amplification (B). To generate DP 2 and DP 3, the adapters have to be changed and subtractive hybridization and selective amplification have to be repeated. ss, single stranded; ds, double stranded.

