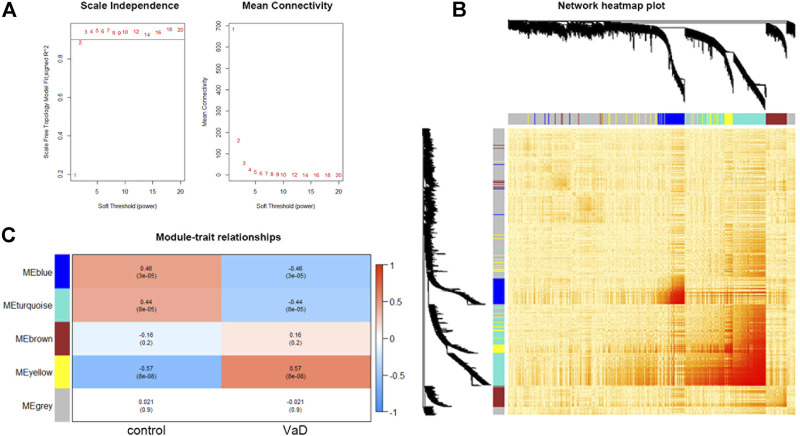
FIGURE 1.
Results and visualization of Weighted Gene Co-expression Network Analysis (WGCNA) analysis. (A) Determination of soft threshold β. Left: scale independence; right: mean connectivity. (B) Heat map showing the TOM among all 5,000 genes involved in the WGCNA with cluster dendrogram showing on the axis. Each color represents one specific co-expression module; the above branches represent genes. The genes with strong correlations are clustered into modules, which are represented as dark sections symmetrically distributed along the diagonal in the heatmap, corresponding to the cluster dendrogram. (C) Module–trait relationships among the five gene modules. The yellow module is the most correlated module (correlation coefficient = 0.57, ***p < 0.001).

