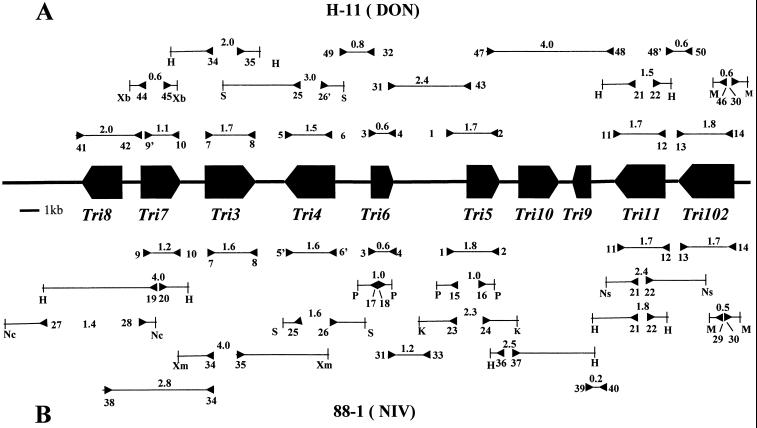
FIG. 1.
PCR strategies for amplification of trichothecene biosynthesis gene clusters from G. zeae strains H-11 (A) and 88-1 (B). Block arrows indicate the locations of Tri ORFs and their transcription directions within the gene cluster. The connecting thick lines represent noncoding DNA regions. The inverted arrowheads indicate PCR primer locations and orientations. Numbers above the thin lines bounded by inverted arrowheads indicate the approximate sizes (in kilobases) of amplified PCR products. Numbers next to or below the inverted arrowheads indicate the primers used (see Table 1 for primer names and sequences), and the letters indicate restriction enzyme sites: H, HindIII; K, KpnI; M, MseI; Nc, NcoI; Ns, NsiI; P, PstI; S, SpeI; Xa, XbaI; Xm, XmnI. Note that Tri101 is not part of the cluster and is not shown here.

