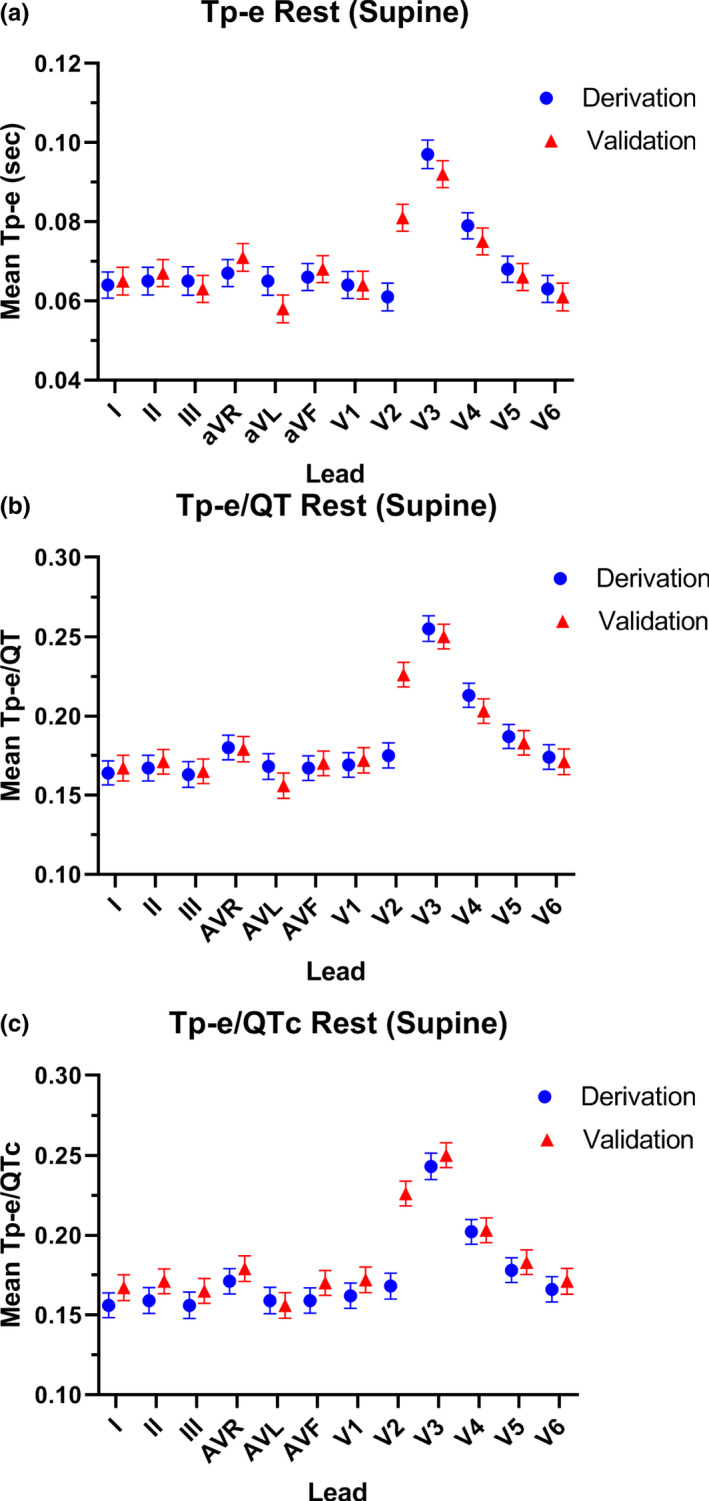
FIGURE 1.

Mean length of each ECG parameter in each lead in the derivation and validation cohorts at rest. In the rest‐supine position, the mean values of the Tp‐e length (a), and Tp‐e/QT ratio (b), and Tp‐e/QTc ratio (c) were not uniform among the 12 leads in the derivation cohort (blue circles) or the validation cohort (red triangles)
