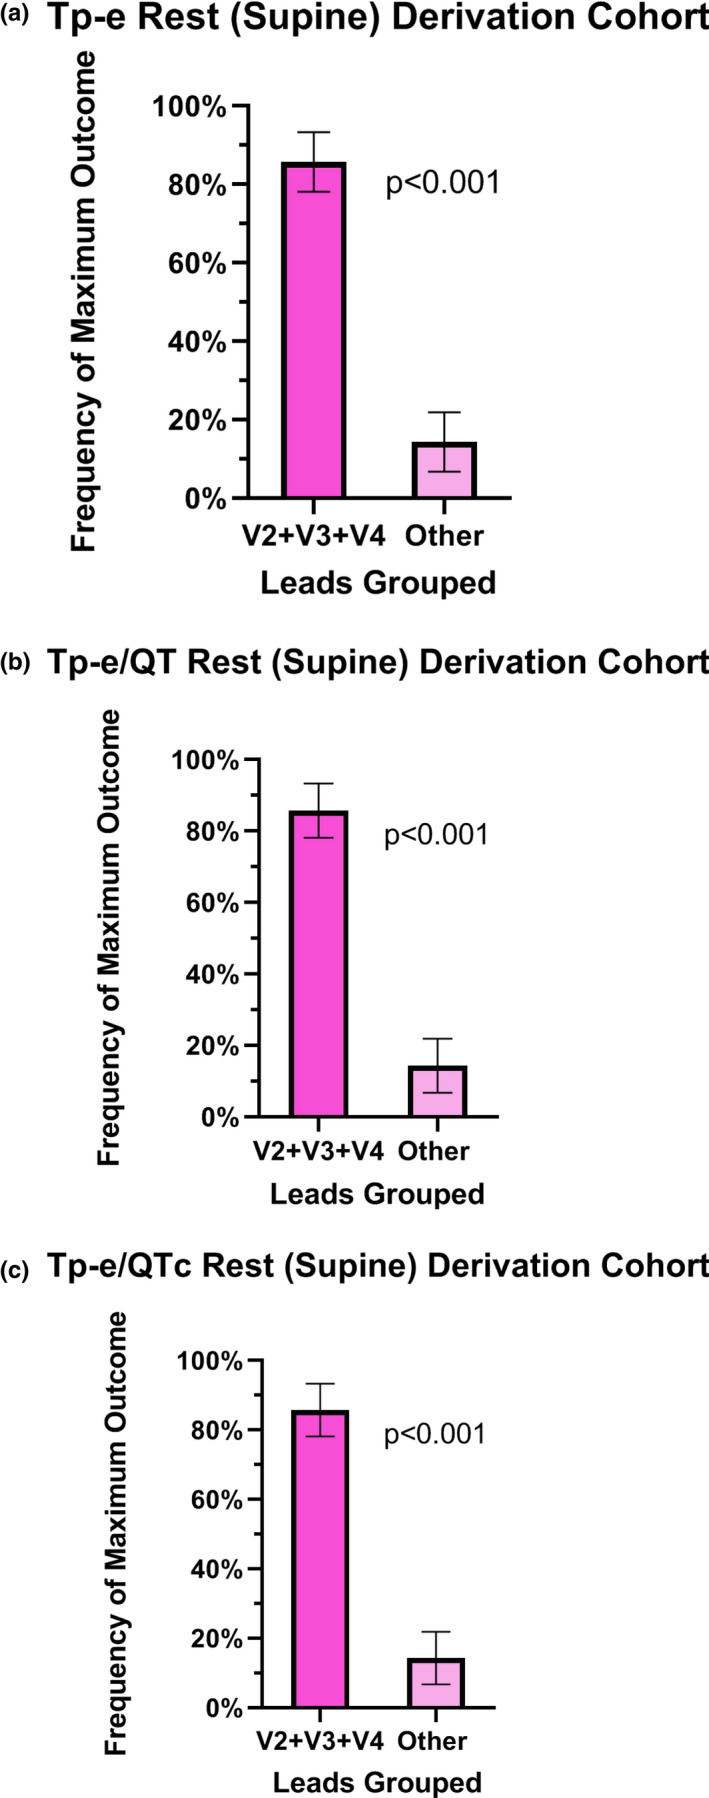
FIGURE 2.

Lead location of the maximal ECG parameter at rest in the derivation cohort. When V2–V4 leads were grouped together, the maximum Tp‐e value was localized to one of these three leads in 85.7% of participants (CI 70.7, 99.9%) versus all other leads (p < .001) (a). The maximum Tp‐e/QT ratio was localized to one of these three leads in 85.7% of participants (CI 70.7, 99.9%) versus other leads (p < .001) (b). The maximum value for Tp‐e/QTc ratio was localized to one of these three leads in 85.7% of participants (CI 70.7, 99.9%) versus all other leads (p < .001) (c)
