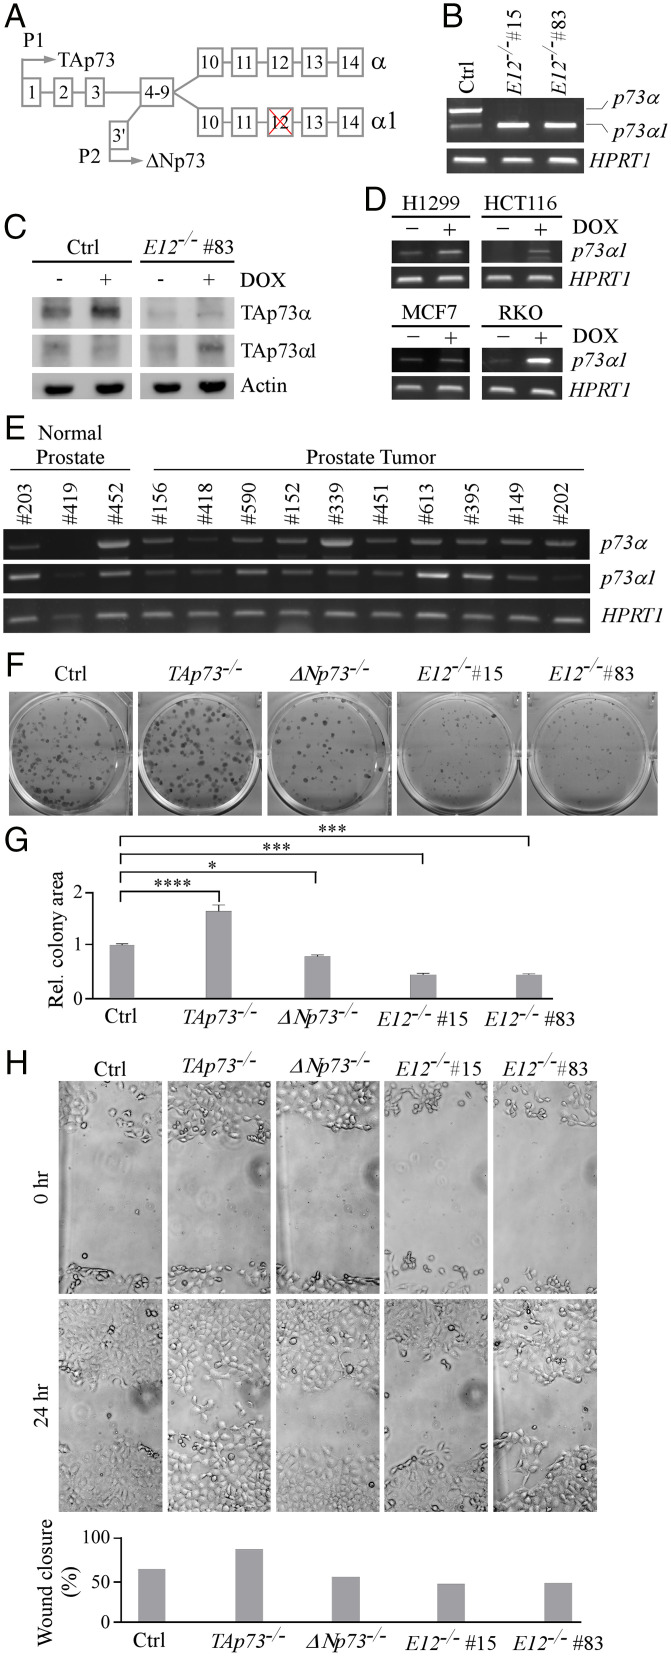
Fig. 1.
Isoform switch from p73α to p73α1 inhibits cell growth and migration in H1299 cells. (A) Schematic representation of TP73 E12 exclusion that leads to isoform switch from p73α to p73α1. (B) The level of p73α, p73α1, and HPRT1 transcripts was measured in isogenic control and E12−/− H1299 cells. (C) The level of TAp73α, TAp73α1, and actin proteins was measured in isogenic control and E12−/− H1299 cells treated with (+) or without (−) 0.25 µM DOX. (D) The level of p73α1 and HPRT1 transcripts was measured in H1299, HCT116, MCF7, and RKO cells treated with (+) or without (−) 0.25 µM DOX. (E) The level of p73α, p73α1, and HPRT1 transcripts was measured in normal human and tumor prostate tissues. (F) Colony formation assay was performed with isogenic control, TAp73−/−, ΔNp73−/−, and E12−/− H1299 cells. (G) Quantification of colony formation assay shown in F using relative colony area. The relative colony area in isogenic control cells was arbitrarily set as 1.0. Data are presented as the mean ± SEM of three independent experiments. One-way ANOVA was used to calculate P values. *P < 0.05; ***P < 0.001; ****P < 0.0001. (H) Isogenic control, TAp73−/−, ΔNp73−/−, and E12−/− H1299 cells were used for scratch assays. Microscopic images were taken immediately after scratch (0 h) and 24 h later to monitor cell migration. Wound closure percentages were quantified and presented below. Ctrl, control; Rel., relative.

