Fig. 6.
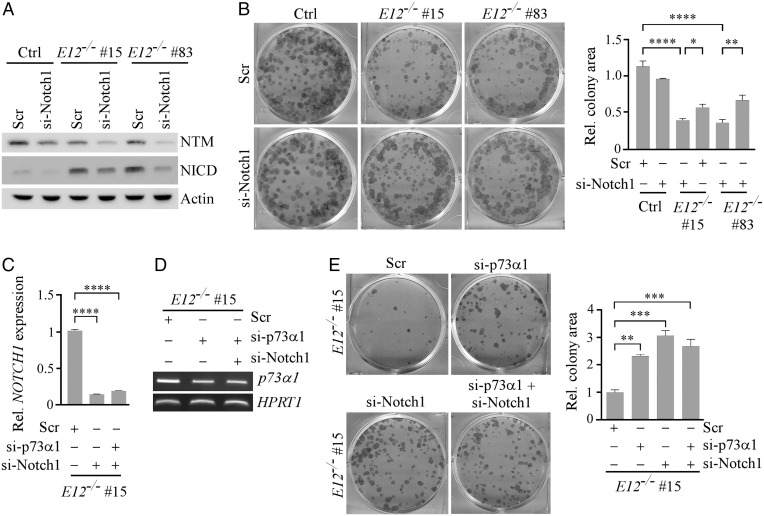
Notch1 is necessary for p73α1-mediated growth suppression in H1299 cells. (A) The level of Notch1 NTM, NICD, and vinculin proteins was measured in isogenic control and E12−/− H1299 cells transiently transfected with Scr or si-Notch1 for 3 d. (B) Cells were treated as in A and used for the colony formation assay. (Right) Quantification of colony formation assay using relative colony area. The relative colony area in isogenic control cells treated with Scr was arbitrarily set as 1.0. Data are presented as the mean ± SEM of three independent experiments. One-way ANOVA was used to calculate P values. *P < 0.05; **P < 0.01; ****P < 0.0001. (C) qPCR was used to analyze relative NOTCH1 expression in E12−/− H1299 cells transiently transfected with Scr, si-Notch1, or si-p73α1 and si-Notch1 for 3 d. One-way ANOVA was used to calculate P values. ****P < 0.0001. (D) The level of p73α1 and HPRT1 transcripts was measured in E12−/− H1299 cells transiently transfected with Scr, si-p73α1, or si-p73α1 and si-Notch1 for 3 d. (E) Colony formation assay was performed with E12−/− H1299 cells transiently transfected with Scr, si-p73α1, si-Notch1, or both for 3 d. (Right) Quantification of colony formation assay using relative colony area. The relative colony area in E12−/− cells treated with Scr was arbitrarily set as 1.0. Data are presented as the mean ± SEM of three independent experiments. One-way ANOVA was used to calculate P values. ***P < 0.001; ****P < 0.0001.

