
Figure 1.
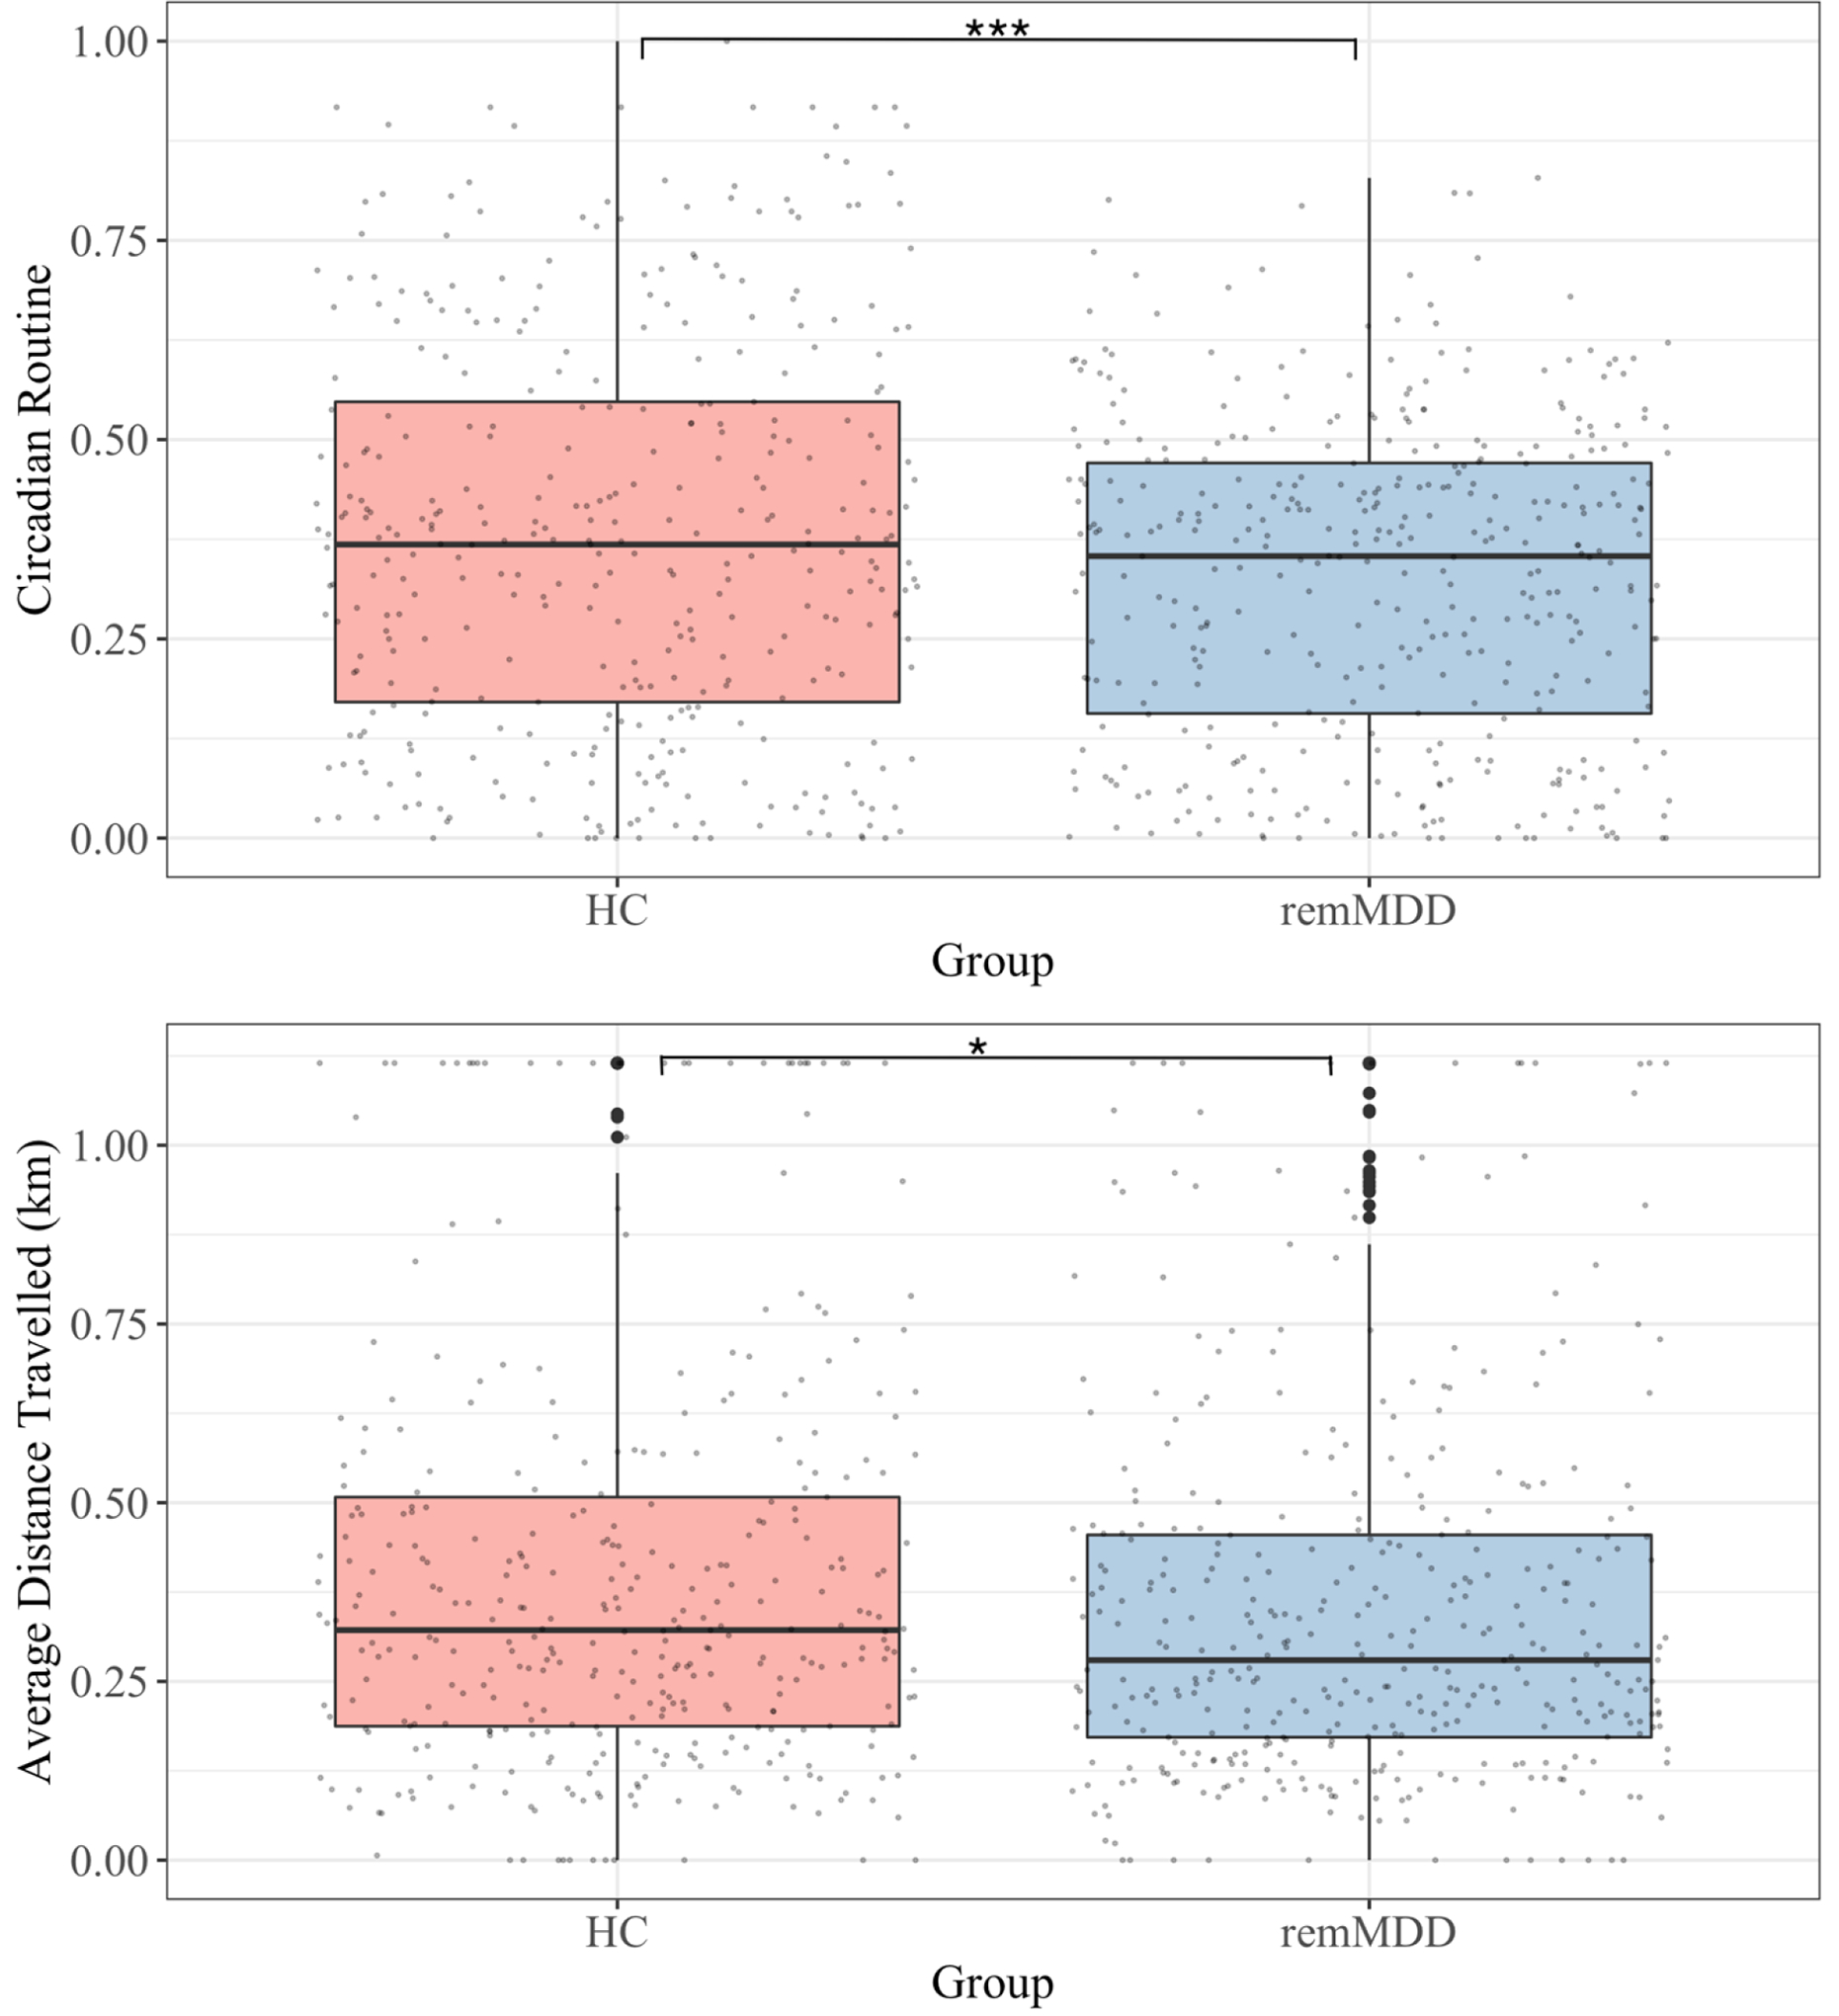
Boxplot Comparison of Circadian Routine and Average Distance Traveled
Note. Top panel shows boxplot comparison of circadian routine between groups across the 20-day study period; Bottom panel displays boxplot comparison of average daily distance traveled across the study period.
*p<.05
***p≤.0001