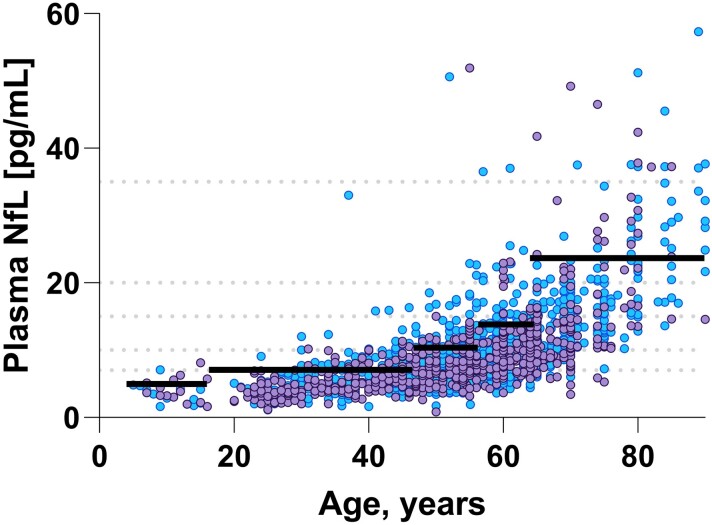
Figure 2.
Age-stratified cut-offs for plasma neurofilament light. This graph displays the age-dependent increase in plasma NfL concentration in individuals aged 5–90. The black solid lines, as well as the grey dashed lines represent the cut-offs derived from a rank-based method estimating the 95th percentile in each age category. The estimated 95th percentiles are shown in brackets after the respective age-categories: (i) 5–17 (7 pg/mL), (ii) 18–50 (10 pg/mL), (iii) 51–60 (15 pg/mL), (iv) 61–70 (20 pg/mL), and (v) >70 (35 pg/mL). Male individuals are indicated by purple dots, and females with blue dots. Three data points with concentrations 63.9, 82.6, and 77.7 pg/mL are not shown for visualization purposes, but were included in all statistical analyses in the paper.

