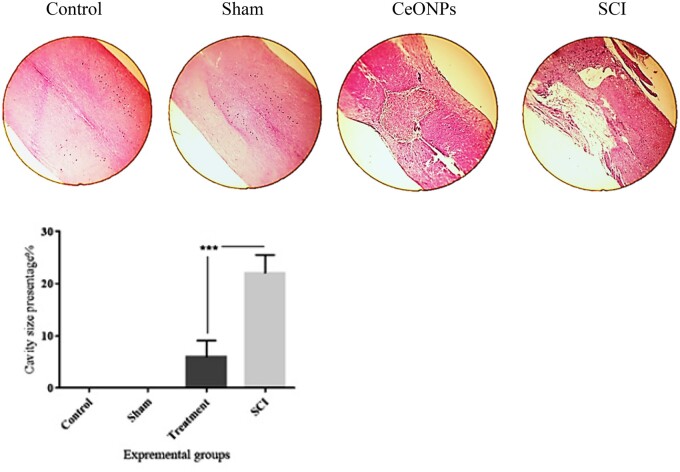
FIGURE 2.
Histological staining (H&E) of longitudinal sections of the spinal cord (5 μm) showing the % cavity size in control, sham, SCI, and treatment group. As shown in the graph, at the sixth week after SCI induction, the cavity size in the SCI group was significantly larger than that in the CeONP group. Data are expressed as mean±SD (***p < 0.001).

