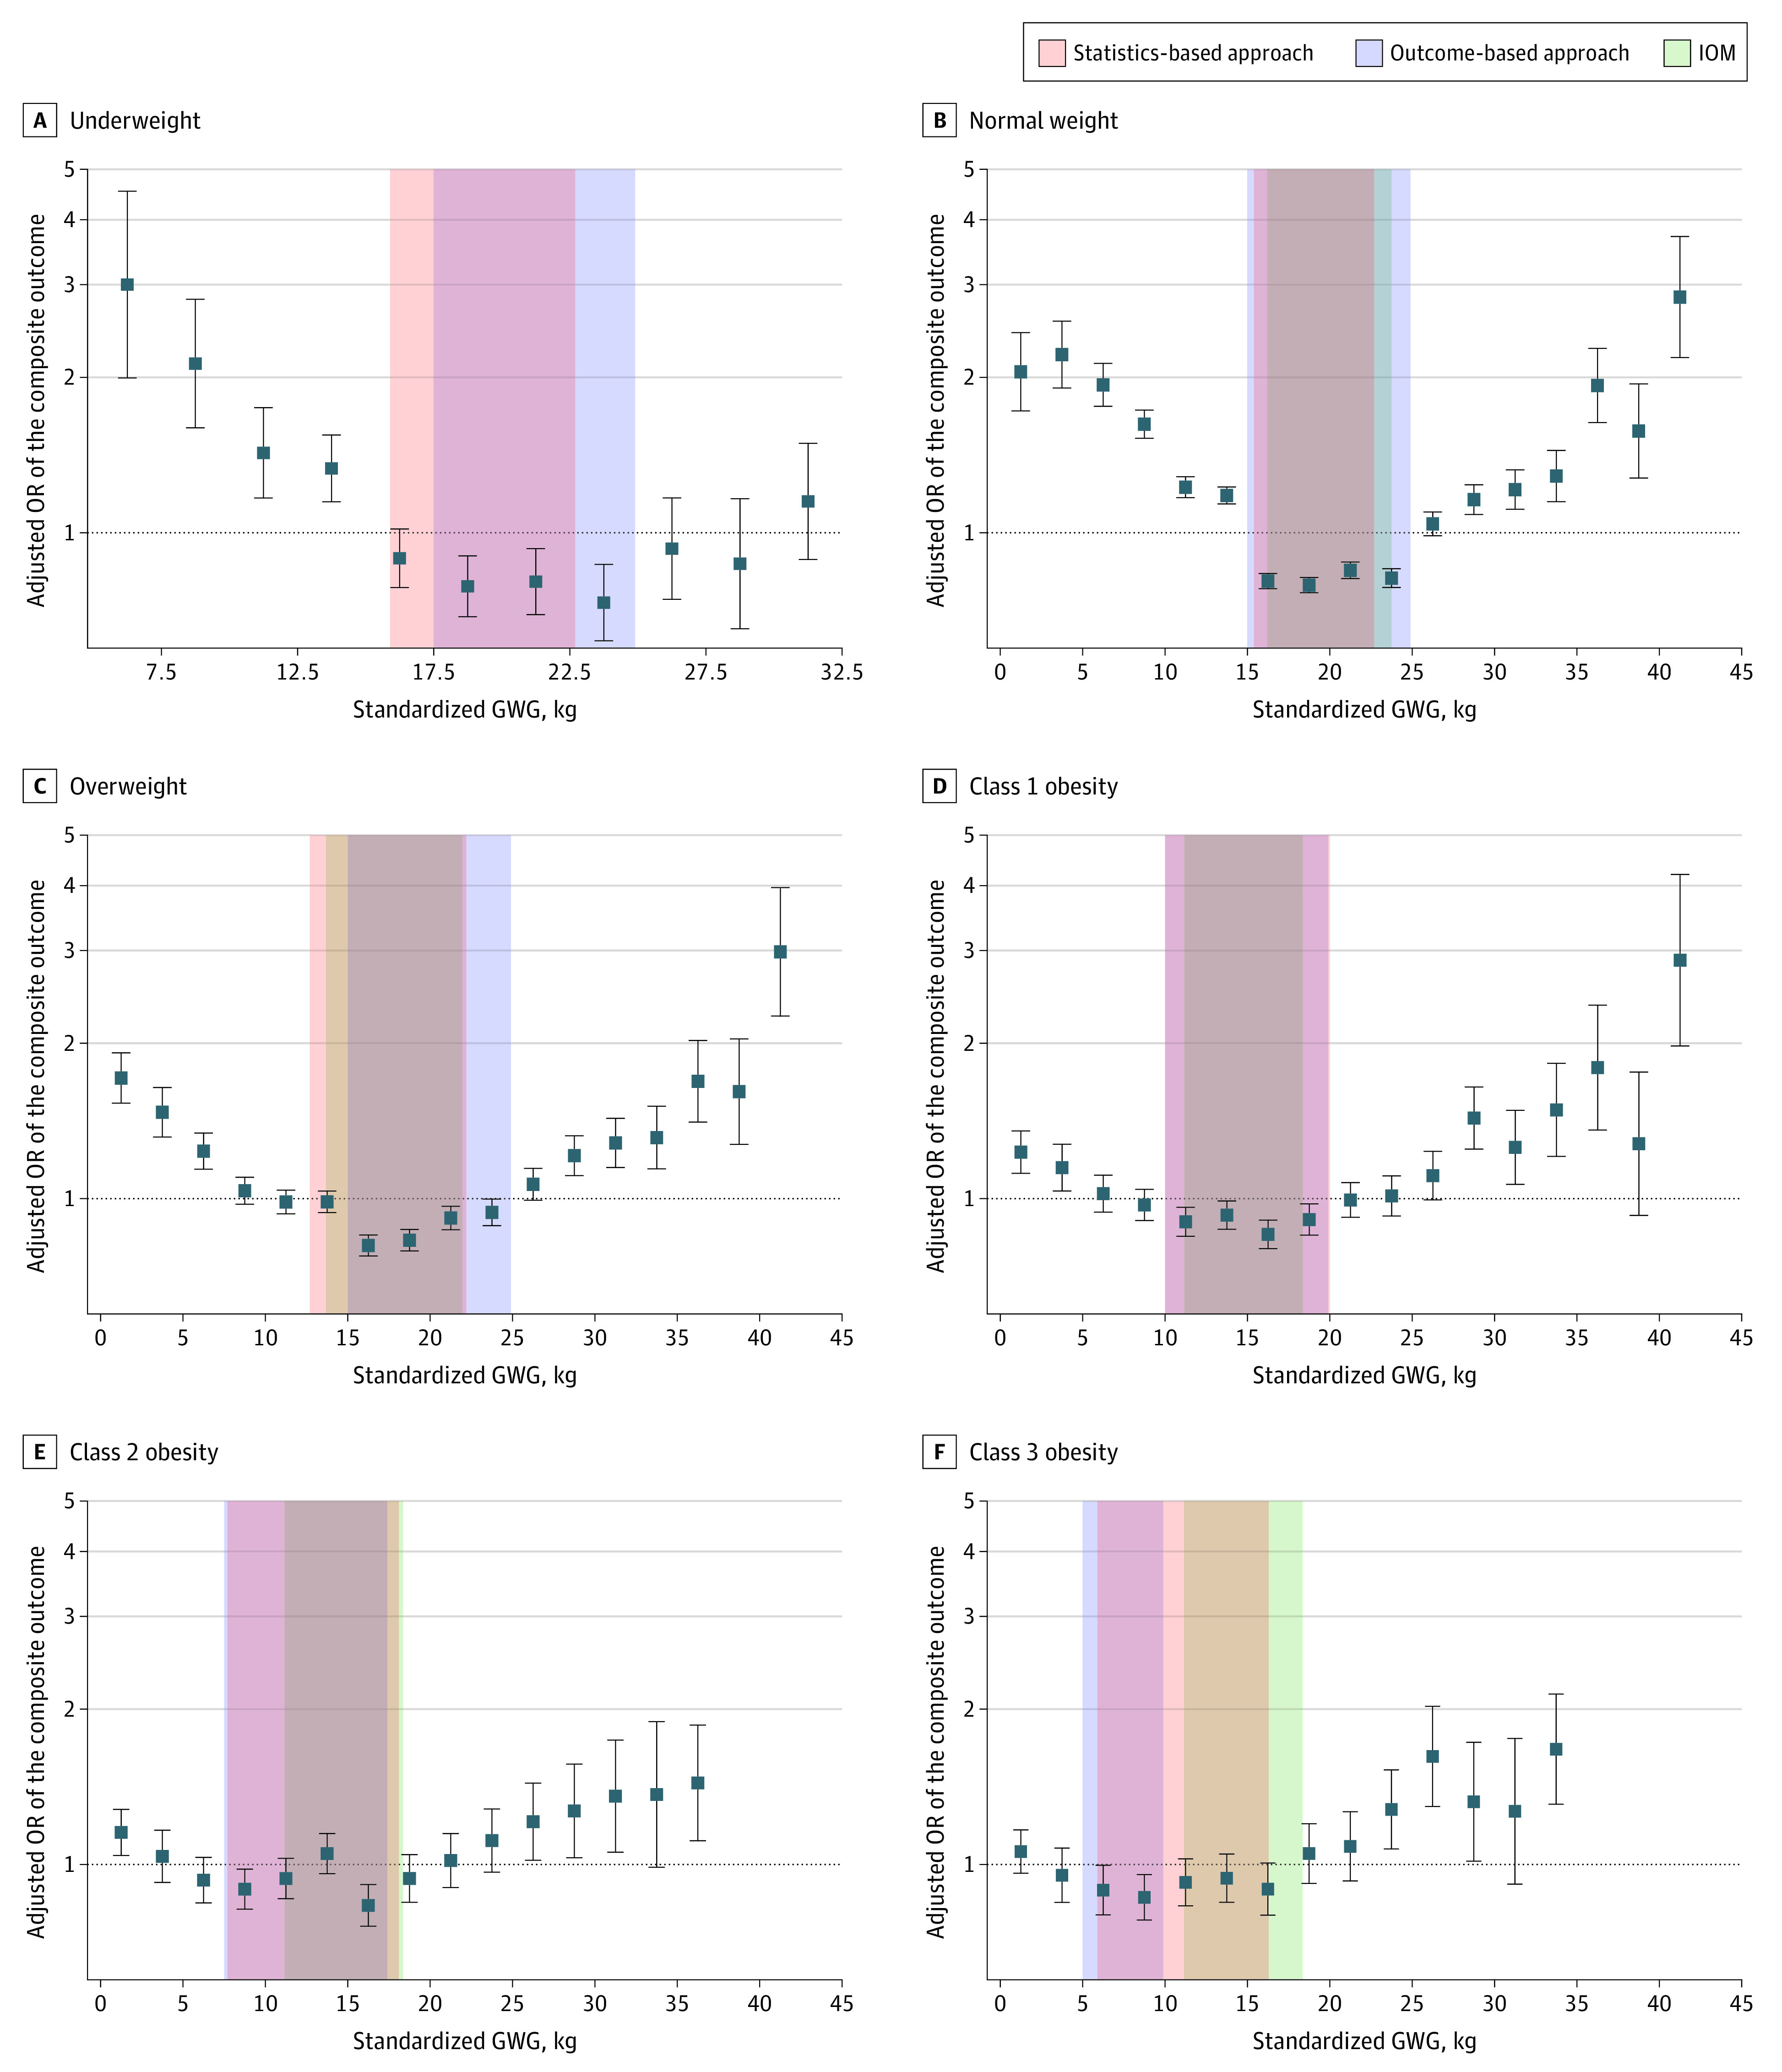
Figure 3. Associations of Gestational Weight Gain (GWG) Groups With the Composite Outcome by Body Mass Index Category.

Orange shaded areas represent optimal GWG ranges as assessed by the statistics-based approach; blue shaded areas, optimal GWG ranges as assessed by the outcome-based approach; and green shaded areas, standardized optimal GWG recommended by the US Institute of Medicine (IOM; 36 weeks’ gestation). Solid squares represent adjusted odds ratio (OR) for all participants in each GWG group; error bars, 95% CIs.
