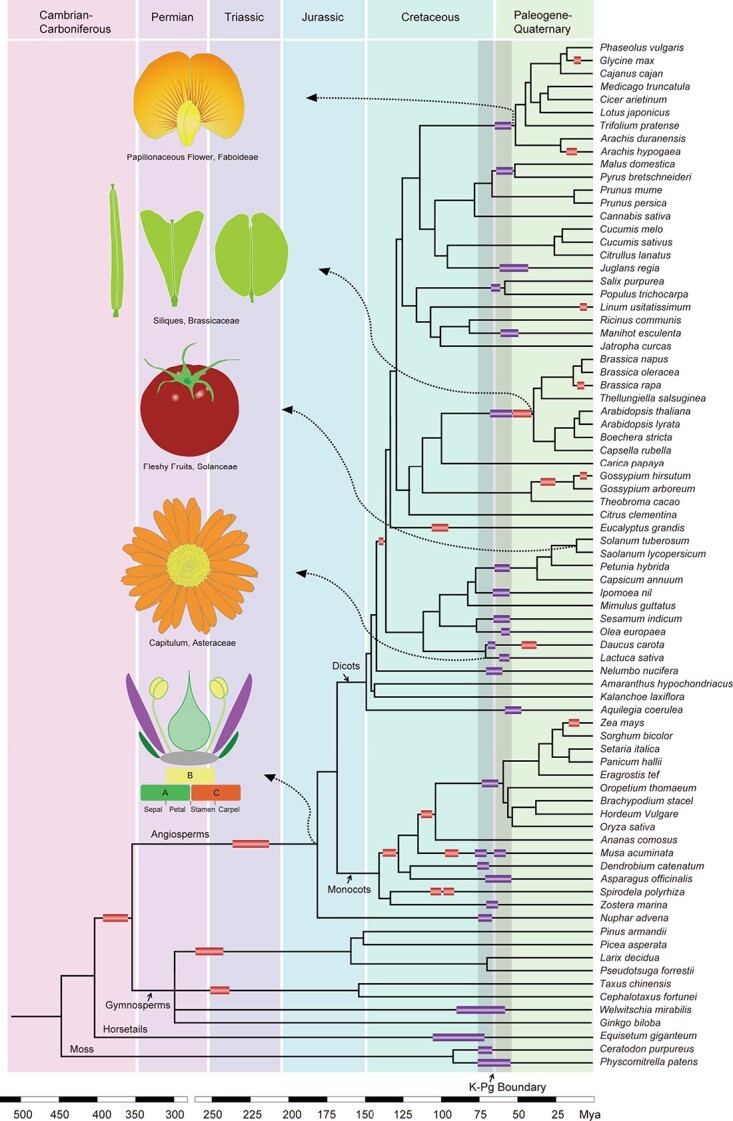
Figure 1.

A phylogenetic tree of plants showing the association of WGDs with morphological innovations. A simplified phylogeny displaying the evolutionary relationship between representative plant species. Mapping of WGDs and key morphological innovations on the phylogeny is based on information from published data (Van de Peer et al., 2017; Cheng et al., 2018; [24, 36]). WGDs estimated to be between 55 and 75 million years old are shown in purple rectangular boxes, while others are shown in red rectangular boxes. The K–Pg boundary is indicated by a grey shaded area.
