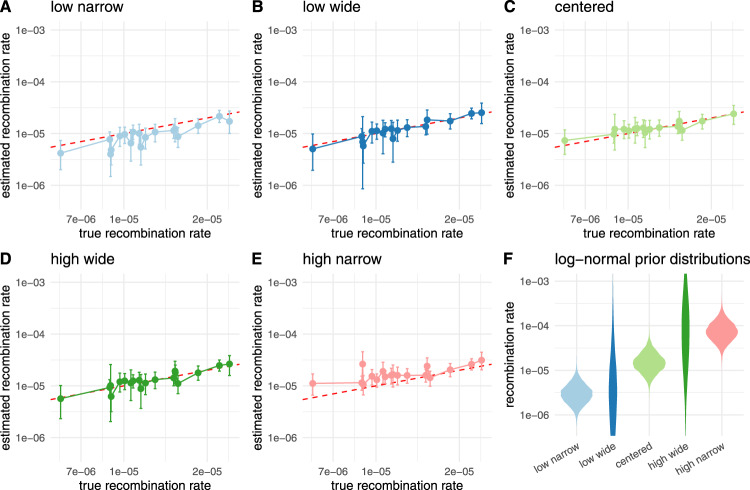
Fig. 5. Impact of the recombination rate prior distribution on the inferred recombination rates.
Here, we compare then inferred recombination rates when using different prior distributions that differed from the distributions from which the rates for simulations were sampled. The rates for simulations were sampled from a log-normal distribution with μ = −11.12 and σ = 0.5. In A, we show the inferred rates when using a prior distribution with μ = −12.74 and σ = 0.5 (leading to a 5 times lower mean in real space than the correct prior). In B, we show the inferred rates when using a prior distribution with μ = −12.74 and σ = 2. In C, we show the inferred rates when using the same prior distribution as was sampled under. In D, we show the inferred rates when using a prior distribution with μ = −9.72 and σ = 2. In E, we show the inferred rates when using a prior distribution with μ = −9.72 and σ = 0.5 (leading to 5 times higher mean in real space than the correct prior). F shows the corresponding density plots for all log-normal distributions used as prior distributions on the recombination rates.

