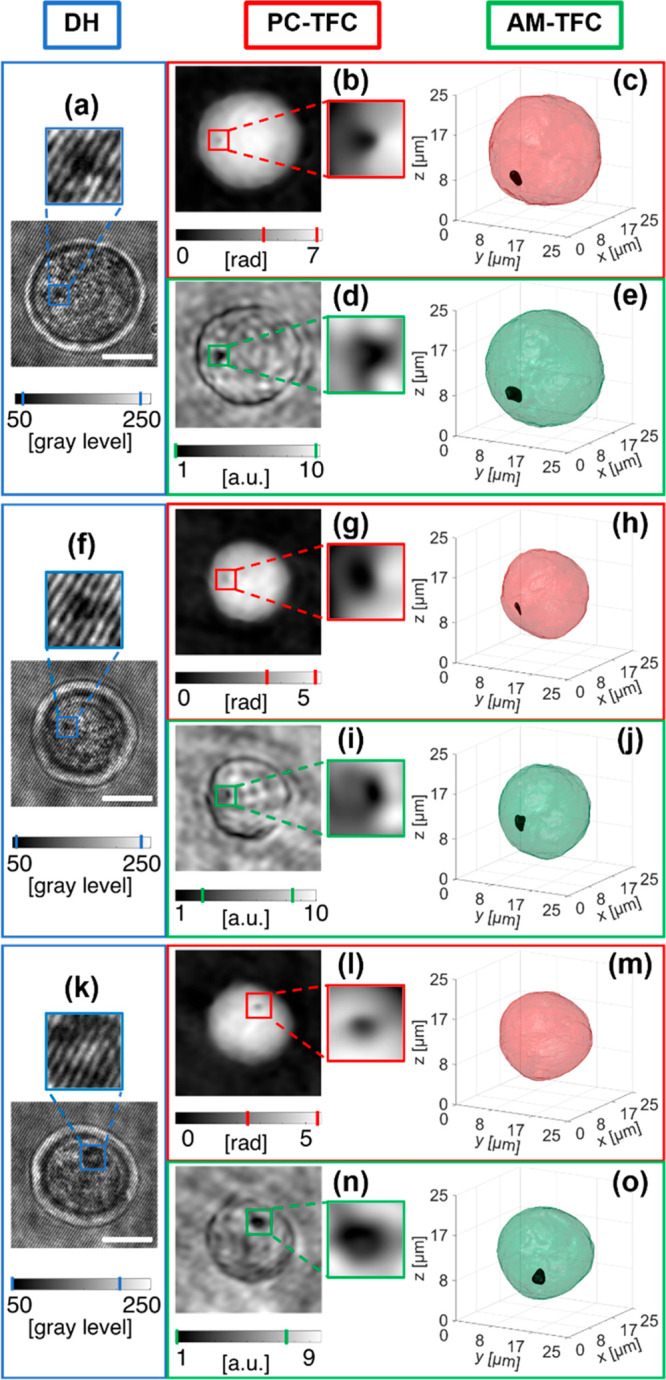
Figure 2.

(See Supporting Movies 2, 3, and 4) Three-dimensional graphene reconstruction through PC-TFC and AM-TFC methods in three NIH-3T3 cells after 24 h treatment with nGO. (a,f,k) ROIs containing the NIH-3T3 cells in the recorded digital holograms in which the accumulation of internalized nGO has a disruptive effect on the interference fringe pattern (blue insert). (b,g,l) Numerically retrieved QPMs with highlights in red (inset), the dark spot due to graphene disturbance in the recorded holograms in (a,f,k). (c,h,m) Isolevel representation of the 3D PC-TFC reconstructions. In (c,h), the nGO accumulation (black) is segmented and isolated from the outer cell (red), while this is not possible in (m). (d,i,n) Numerically retrieved AMs, with highlights in green (inset), the dark spot due to graphene disturbance in the recorded holograms in (a,f,k). (e,j,o) Isolevel representation of the 3D AM-TFC reconstructions in which the nGO accumulation (black) is segmented and isolated from the outer cell (green). Scale bars are 10 μm. The intervals highlighted in the colorbars refer to the insets.
