Figure 3.
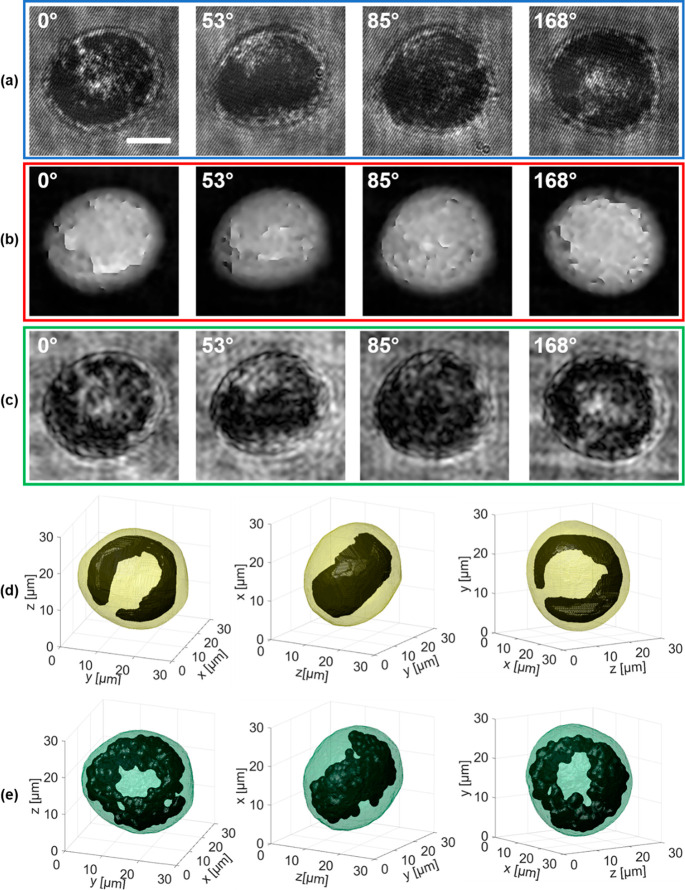
(Supporting Movie 5) Three-dimensional graphene reconstruction in an NIH-3T3 cell after 48 h treatment with nGO. (a) Four frames taken from the recorded holographic sequence of the rolling cell, from which a ring-shaped nGO spatial distribution can be inferred. (b) QPMs numerically retrieved from (a), in which the phase jumps are not corrected by the unwrapping algorithm. (c) AMs numerically retrieved from (a), in which the dark regions are due to the light attenuation of the internalized graphene. (d,e) Three views of the isolevels representation of the tomogram reconstructed through SFS and AM-TFC algorithms, respectively, in which the internalized nGO (black), segmented and isolated from the outer cell (yellow and green, respectively), distributes as a 3D ring, as observed in 2D images in (a–c). Scale bar in (a) is 10 μm. In (a–c), the estimated viewing angles are reported at the top.

