Figure 6.

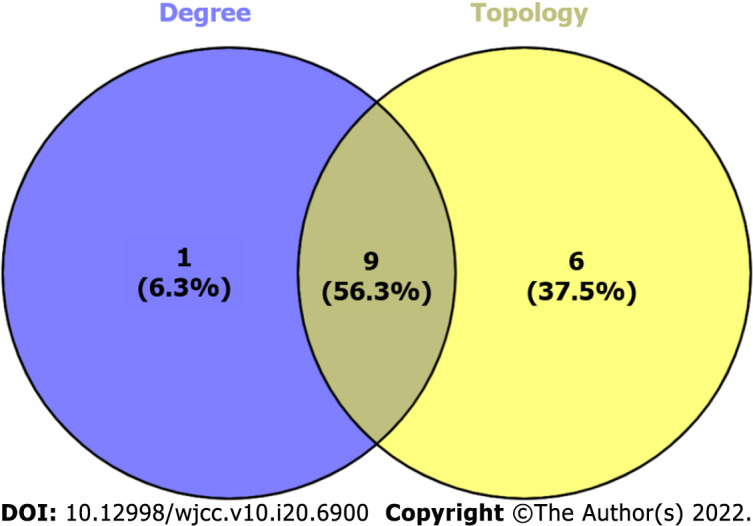
The Venn diagram of cytoHubba and CytoNCA-related targets. 1 cytoHubba non-intersection targets (left), 9 cytoHubba and CytoNCA intersection targets (middle) and 6 CytoNCA non-intersection targets (right).

The Venn diagram of cytoHubba and CytoNCA-related targets. 1 cytoHubba non-intersection targets (left), 9 cytoHubba and CytoNCA intersection targets (middle) and 6 CytoNCA non-intersection targets (right).