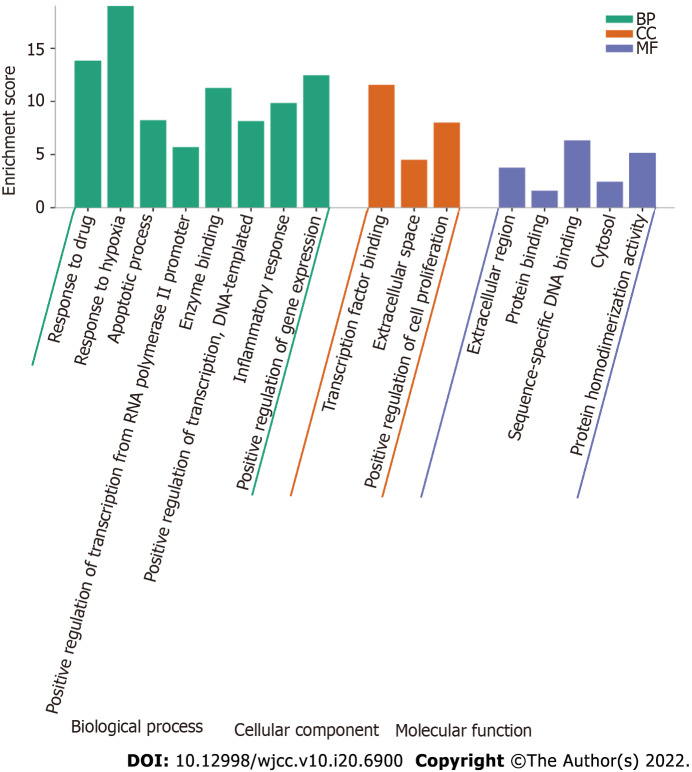
Figure 7.
Gene Ontology enrichment analysis of 115 overlapping genes. The top Gene Ontology enriched terms with P < 0.001 and count > 5 were screened. The X-axis is the enrichment gene ratio, and the Y-axis is the molecular function or biological process. CC: Cellular component; BP: Biological process; MF: Molecular function.

