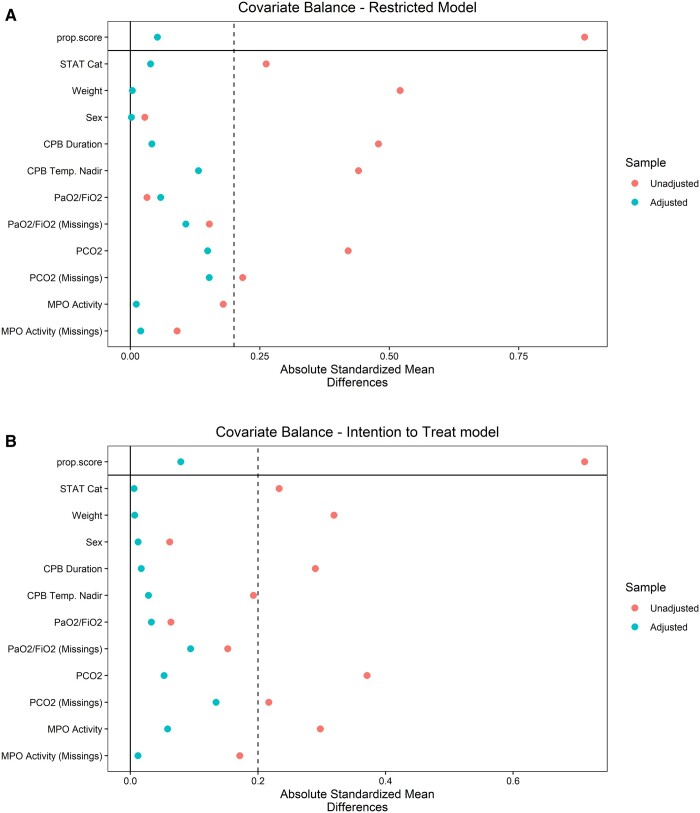
Figure 1:
Absolute mean differences for propensity score variables. Variables are shown before (‘unadjusted’) and after (‘adjusted’) propensity score weighting. Missing values are also weighted in the variables that have some. Panel (A) refers to the restricted model (only patients that completed the ventilation on cardiopulmonary bypass procedure were included) and panel (B) refers to the intention-to-treat model (all patients were included. Patients partially ventilated during cardiopulmonary bypass were included in the ventilated group). The absolute standardized mean difference is calculated as the absolute value in the difference in means of a variable across the treatment groups, divided by the standard deviation in the treated group. It is a measure of the effect size of the differences.

