Fig. 2.
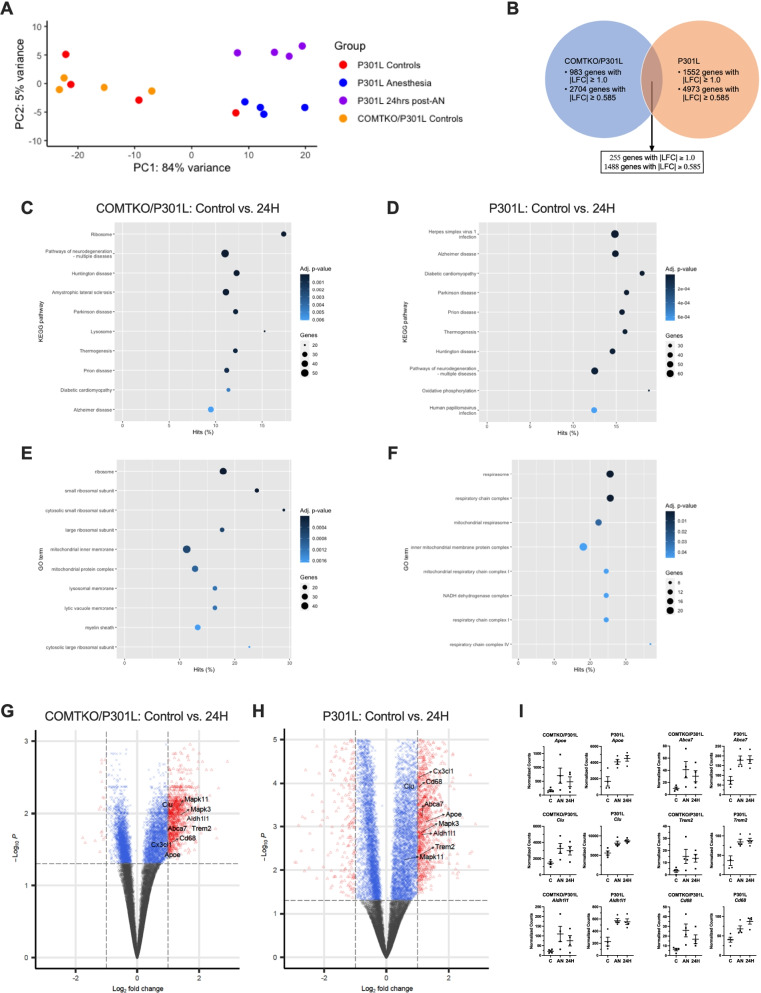
Transcriptomic response in the forebrain of COMTKO/P301L and P301L mice 24 h after isoflurane administration. A Principal component analysis showing segregation of anesthetized P301L mice from the control groups of COMTKO/P301L and P301L mice. B Venn diagram depicting the number of genes that exceed the absolute log2-fold-change (LFC) threshold of 1.0 and 0.585 in the COMTKO/P301L, P301L, and both mouse models. C–F Kyoto Encyclopedia of Genes and Genomics (KEGG) pathways (C, D) and Gene Ontology (GO)-cellular component terms (E, F) that were over-represented in the COMTKO/P301L (C, E) and P301L (D, F) mice 24 h after anesthesia. G, H Volcano plots showing differentially expressed genes in the COMTKO/P301L (G) and P301L (H) mice 24 h after anesthesia. The x- and y-thresholds indicate the FDR-adjusted p-value of 0.05 and LFC of 1.0, respectively. I Comparison of normalized counts of genes that are associated with late-onset AD and are expressed in astrocytes and microglia. The genes were differentially expressed immediately and 24 h after anesthesia. In each mouse model, n = 4 per group. Data are mean ± SEM. *q < 0.05. C, Controls; AN, Anesthesia; 24H, 24-h post-anesthesia

