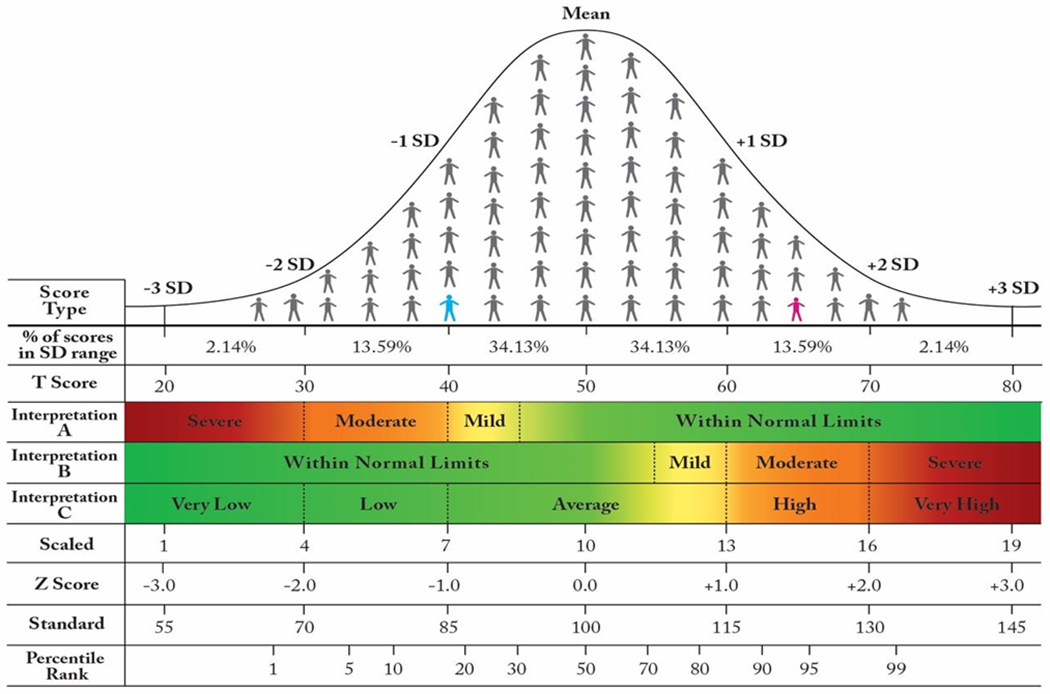
Figure 2.

A Normal Distribution, Standardized Scores, and SD-Based PROM Score Interpretation
The person in blue is −1.0 SD below the mean. The person in pink is 1.5 SD above the mean. PROM Interpretations A and B are mirror images of one another.
Abbreviation: SD, standard deviation.
