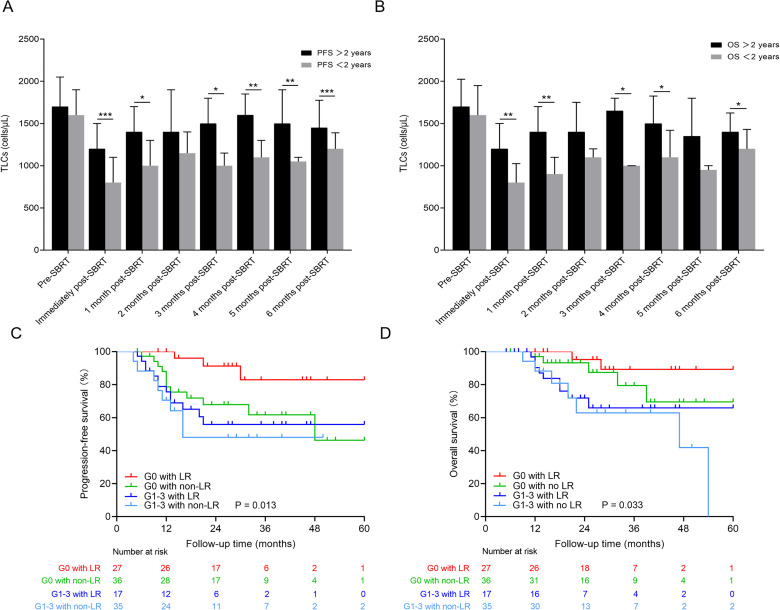
Figure 2.
(A and B) Distribution of TLCs at each time stratified by survival (PFS > 2 years vs PFS < 2 years and OS > 2 years vs OS < 2 years). ***P < .001, **P < .01, and *P < .05. (C) PFS curves are shown for G0 lymphopenia patients with LR within 6 months after SBRT (red), G0 lymphopenia patients with no LR (green), G1-3 lymphopenia patients with LR (blue), and G1-3 lymphopenia patients with no LR (light blue). (D) OS curves for the groups of patients described for (C).
Abbreviations: TLC, total lymphocyte count; SBRT, stereotactic body radiation therapy; PFS, progression-free survival; OR, odds ratio; LR, lymphocyte count recovery.

