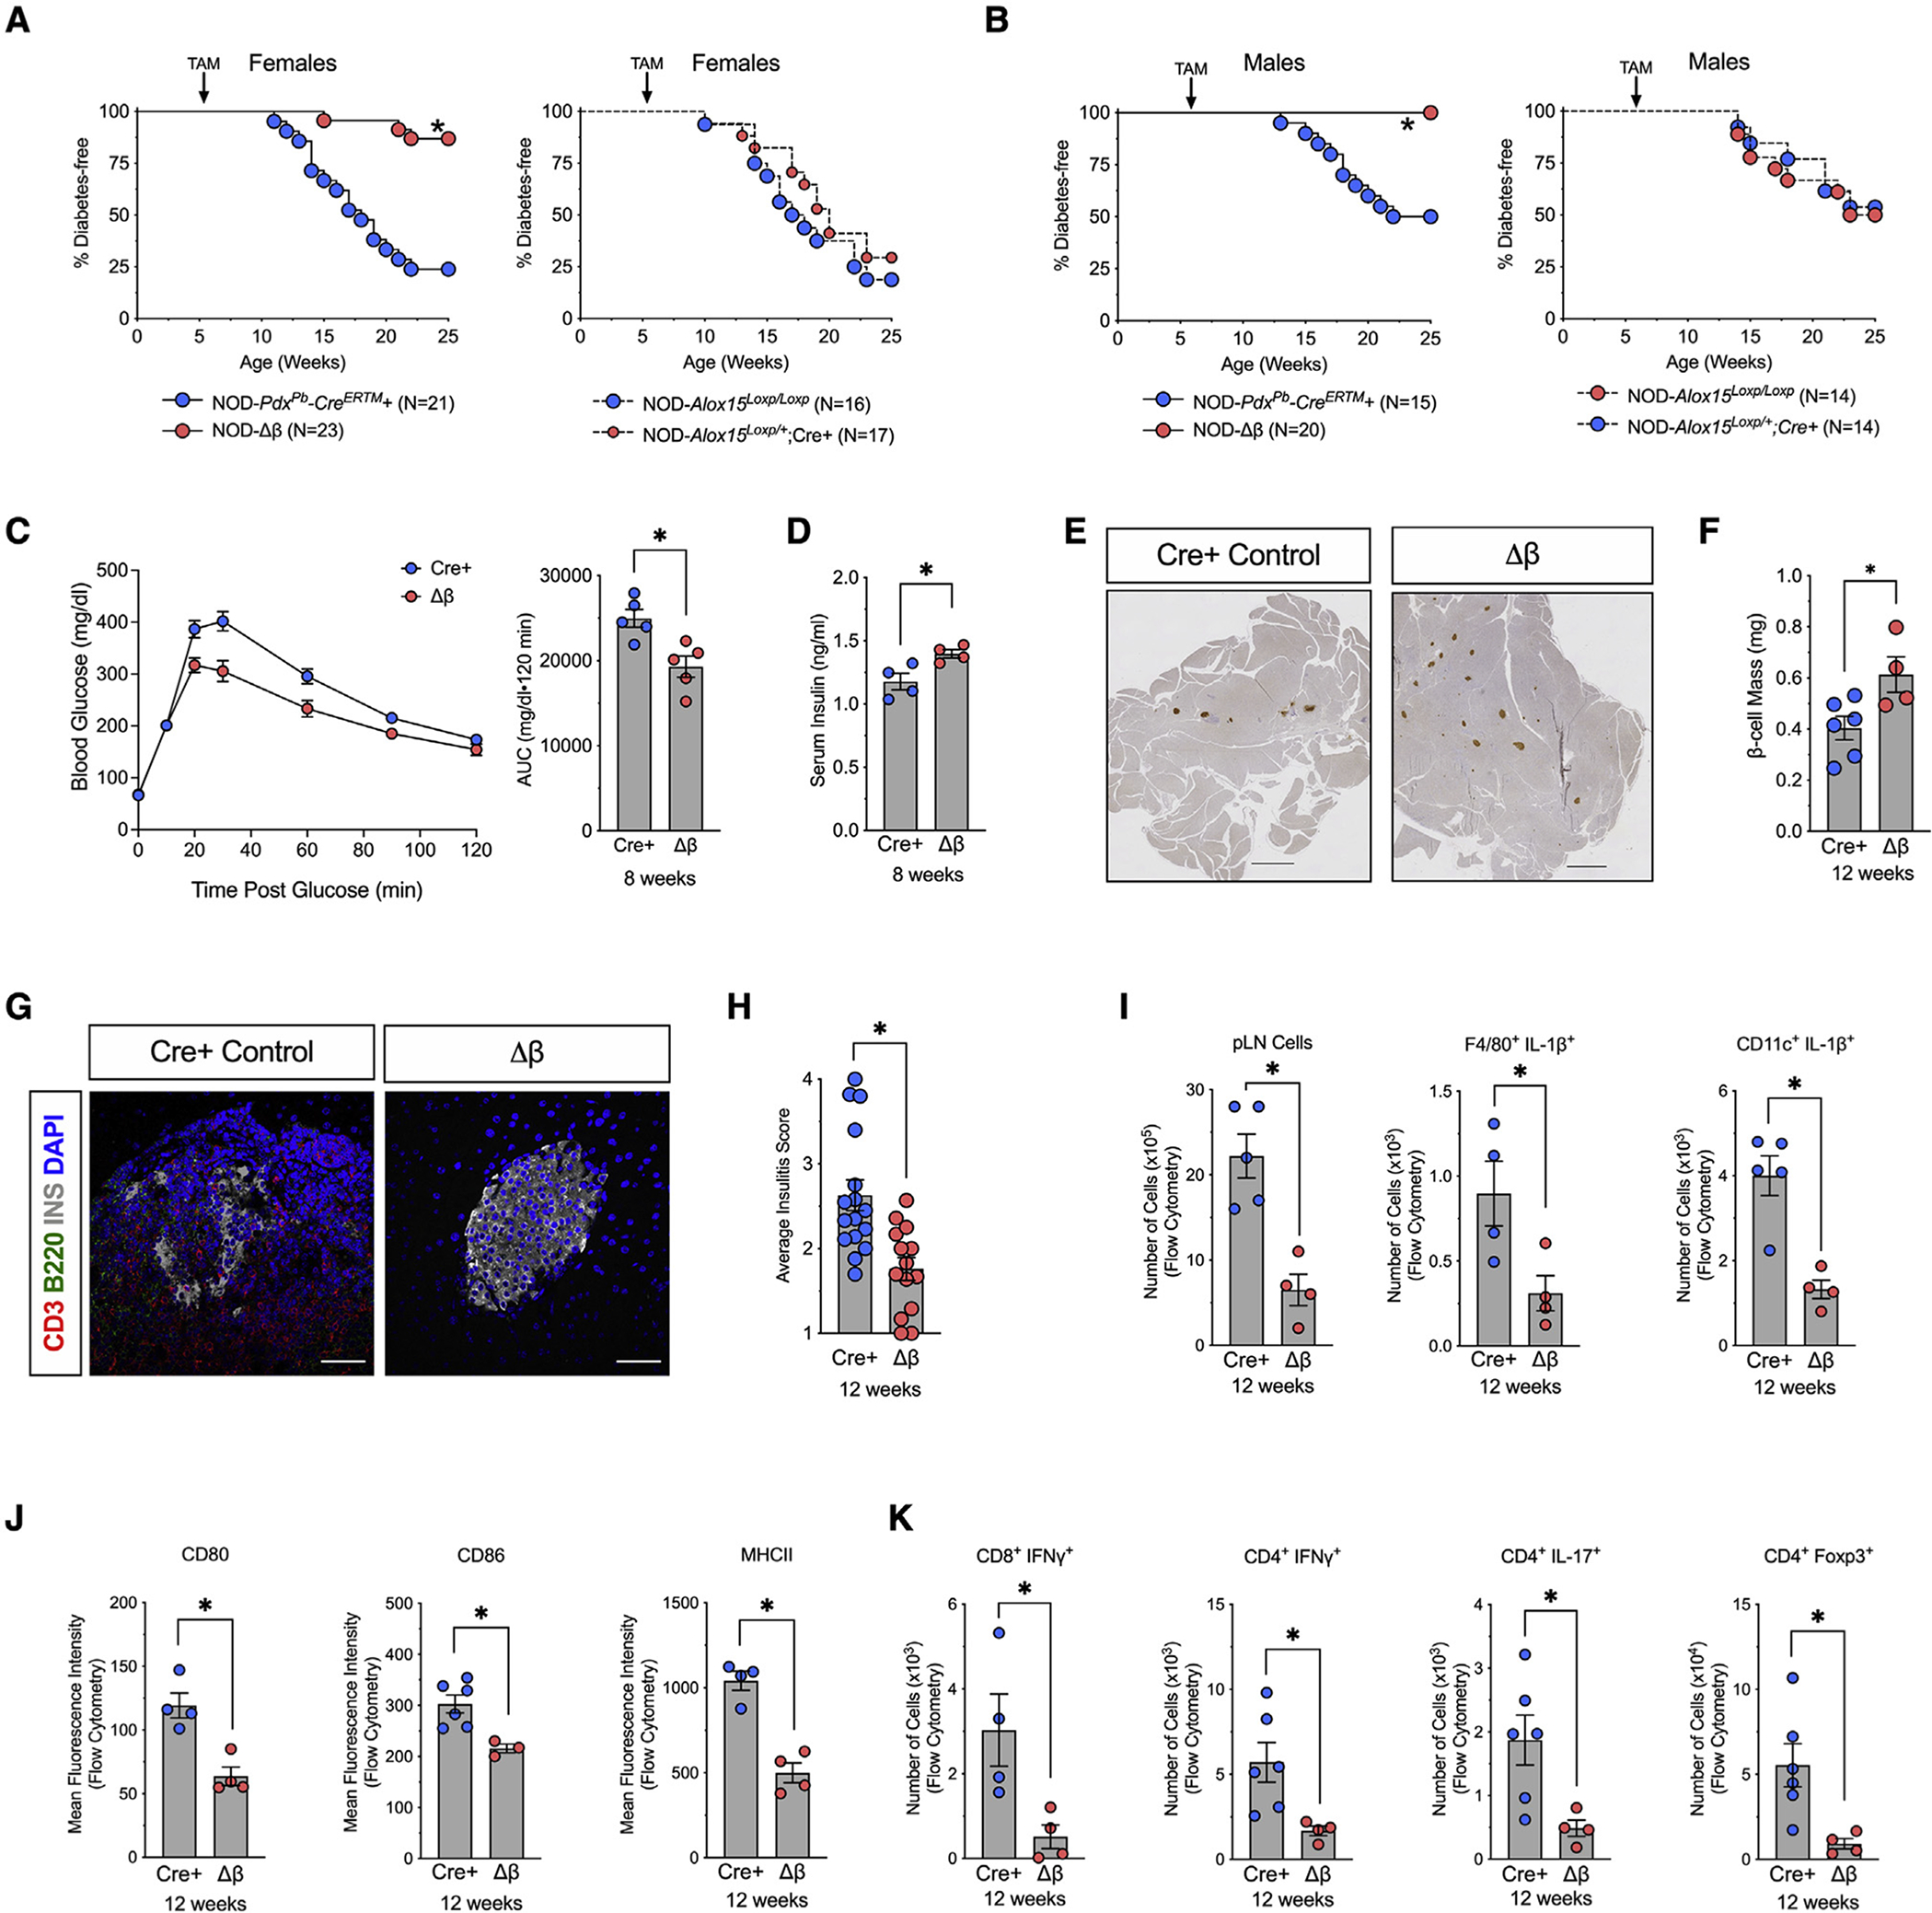
Figure 2. Deletion of Alox15 in β cells protects against development of T1D in NOD mice.

NOD-Alox15loxP/+ mice were crossed with NOD-Pdx1PB-CreER™ mice to generate NOD-Cre+ and NOD-Δβ mice. At 6 weeks of age, all mice were administered 3 daily intraperitoneal injections of 2.5 mg of tamoxifen.
(A) Kaplan-Meier curves showing diabetes incidence by genotype in females. N = 16–23 biological replicates.
(B) Kaplan-Meier curves showing diabetes incidence by genotype in males. N = 14–20 biological replicates.
(C) Glucose-tolerance test and area under the curve calculation at 8 weeks of age. N = 5 biological replicates.
(D) Serum insulin levels at 8 weeks of age. N = 5 biological replicates.
(E) Images of whole pancreatic sections from representative mice at 12 weeks of age, immunostained for β cells (insulin, brown), and counterstained with hematoxylin. Scale bars, 500 μm.
(F) Quantification of β cell mass. N = 6 mice, 5 slides per mouse.
(G) Representative images of pancreata from mice at 12 weeks of age stained for T cells (CD3, red), Β cells (B220, green), β cells (insulin, white), and nuclei (DAPI, blue). Scale bars, 50 μm.
(H) Average insulitis score in NOD-Cre+ controls and NOD-Δβ mice at 12 weeks of age. N = 3 mice, 5 slides per mouse.
(I–K) Pancreatic lymph nodes (pLNs) were isolated from NOD-Cre+ and NOD-Δβ mice at 8 weeks of age and analyzed by flow cytometry.
(I) Quantification of total cells and the number of proinflammatory macrophages (F4/80+IL-1β+) and dendritic cells (CD11c+IL-1β+).
(J) Mean fluorescent intensity of co-stimulatory molecules (CD80, CD86) and MHC class II by flow cytometry.
(K) Quantification of the number of CD4+ T cells; subclasses as indicated. N = 3–5 biological replicates.
Data are expressed as the mean ± SEM. *p < 0.05 for the comparisons indicated.
