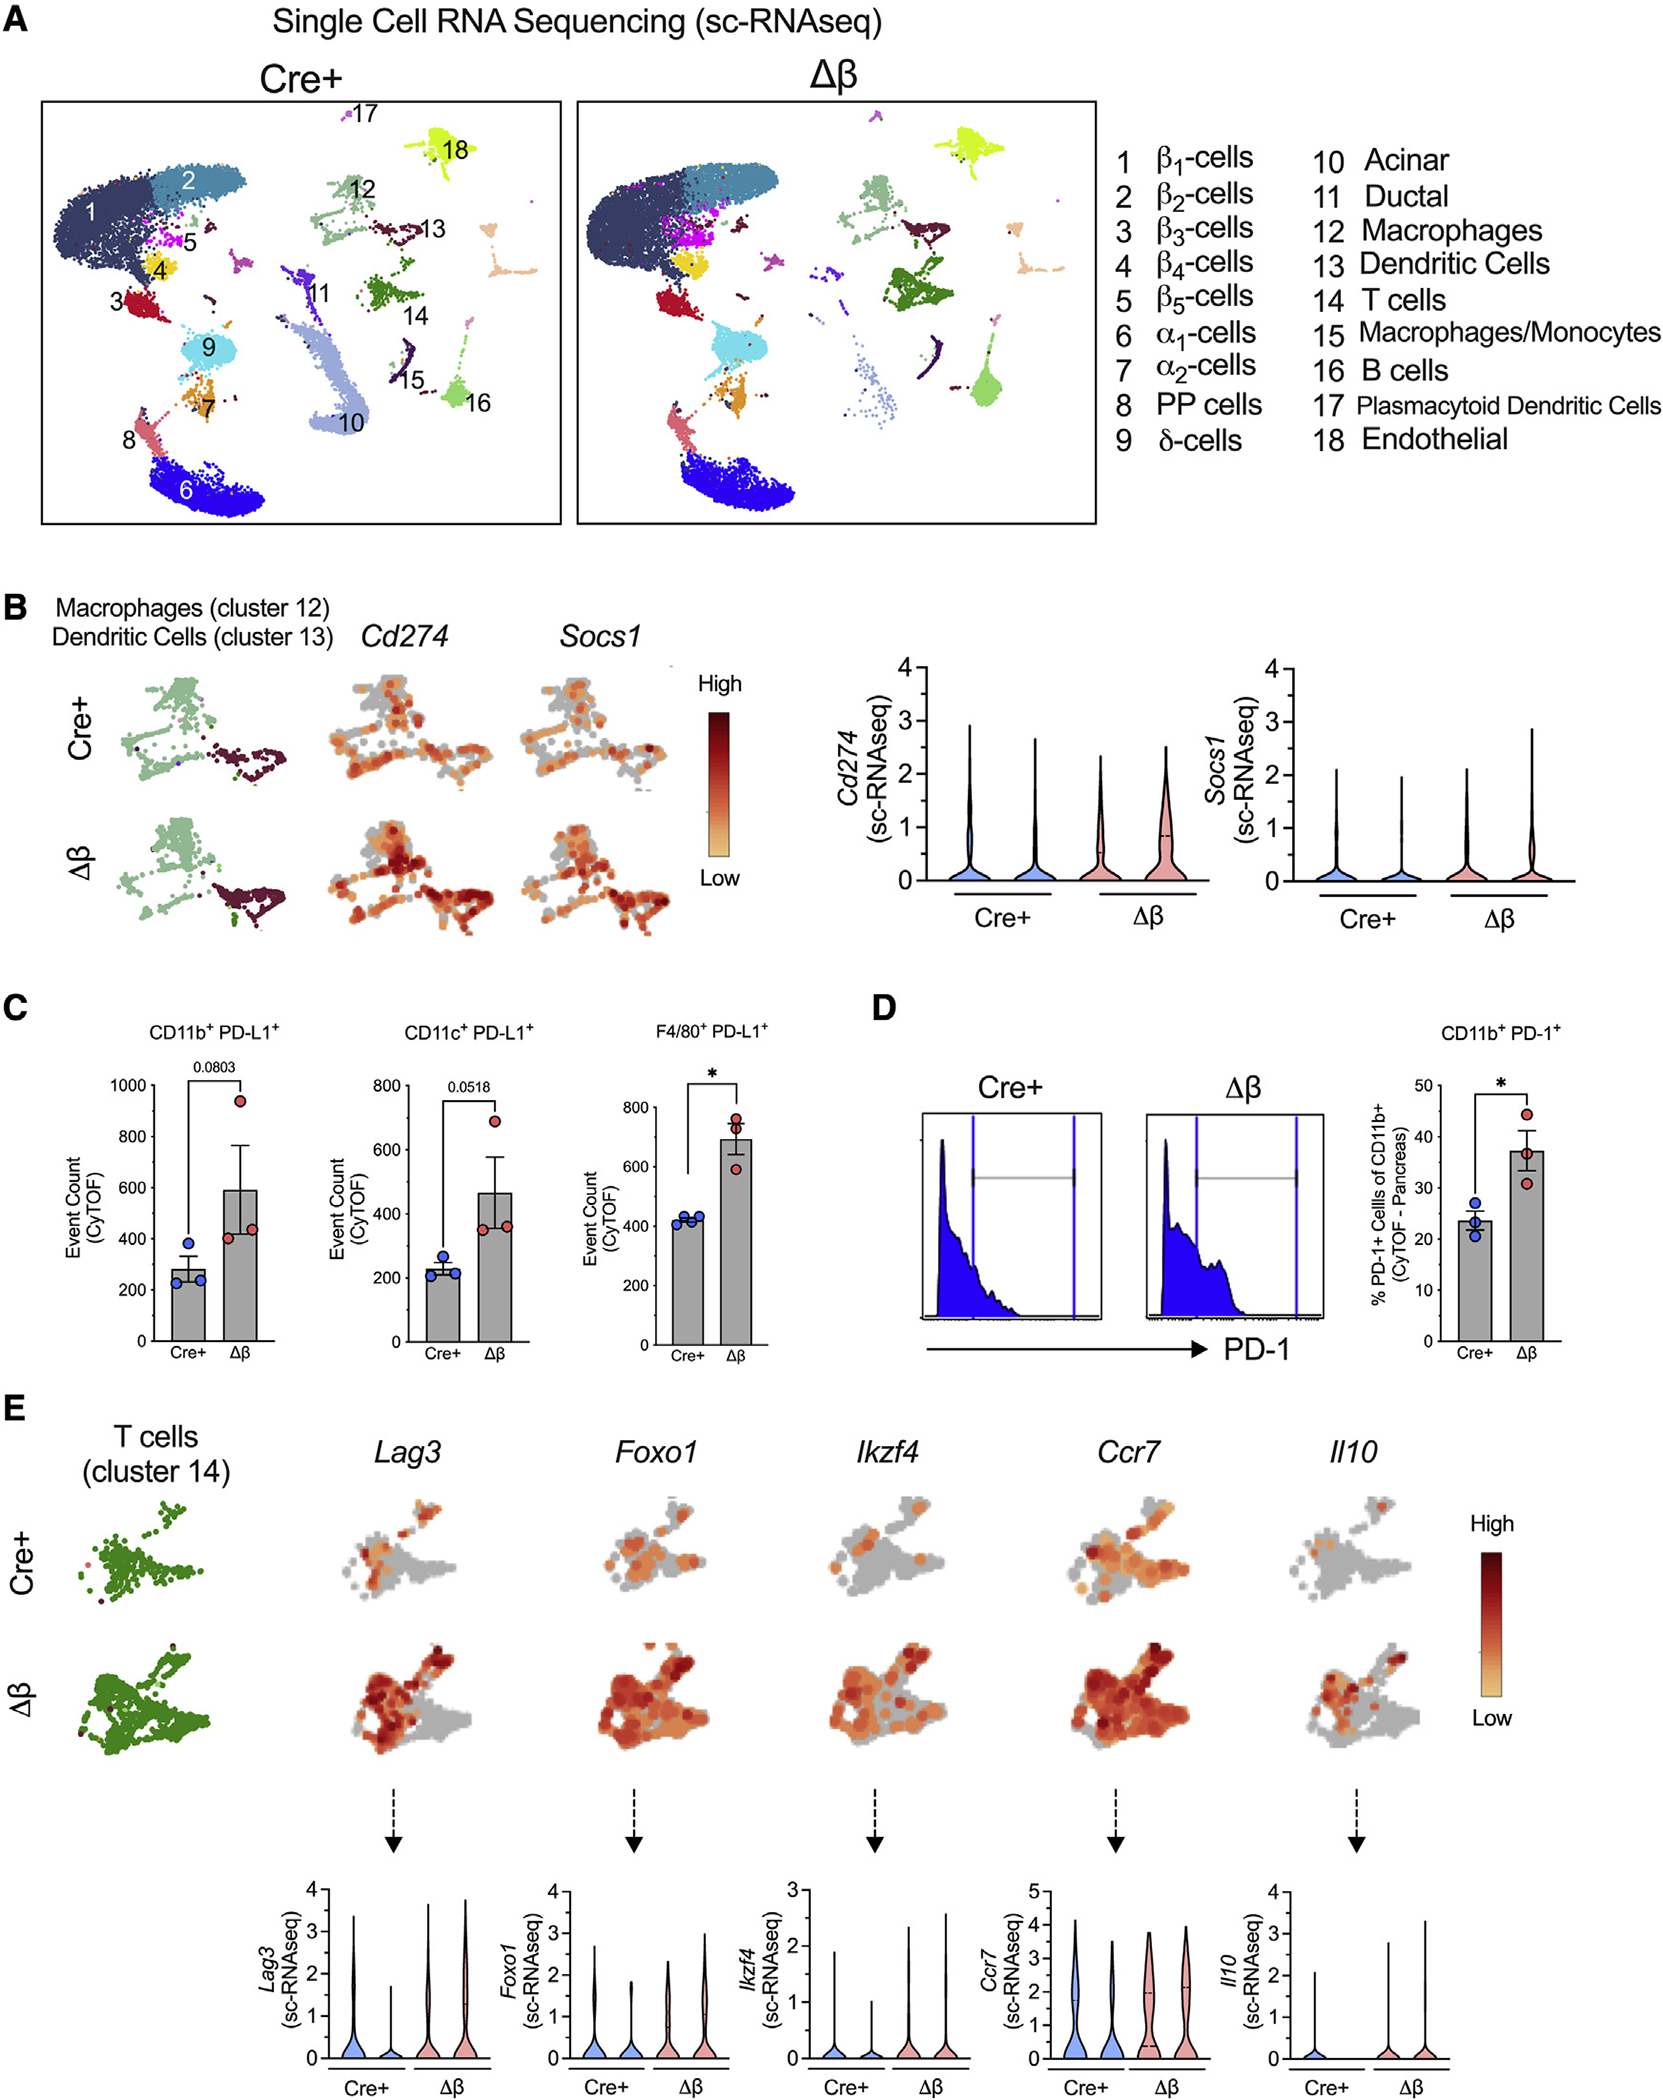
Figure 4. Single-cell RNA sequencing analysis of islets and CyTOF of pancreas in NOD-Cre+ and NOD-Δβ mice.

(A–E) Islets or pancreata were isolated from NOD-Cre+ and NOD-Δβ mice at 8 weeks of age, dissociated into single cells, and subjected to single-cell RNA sequencing (A, B, and E; N = 2 individual animal replicates) or CyTOF (C and D, N = 3–4 individual animal replicates), respectively.
(A) Uniform manifold approximation and projection (UMAP) embeddings of merged single-cell RNA sequencing profiles from islets colored by cell clusters that were identified.
(B) UMAP gene expression patterns and violin plots of Cd274 and Socs1 in a combined macrophage cluster (cluster 12) and a dendritic cell cluster (cluster 13) (false discovery rate [FDR] < 0.05).
(C) Number of PD-L1-positive cells expressed by CD11b+, CD11c+, and F4/80+ cells identified by CyTOF of whole pancreatic cells.
(D) Frequency of CD11b+PD-1+ cells.
(E) UMAP gene-expression patterns and violin plots of Lag3, Foxo1, Ikzf4, Ccr7, and Il-10 in the T cell cluster (cluster 14) (FDR < 0.05).
Data are expressed as the mean ± SEM. *p < 0.05.
