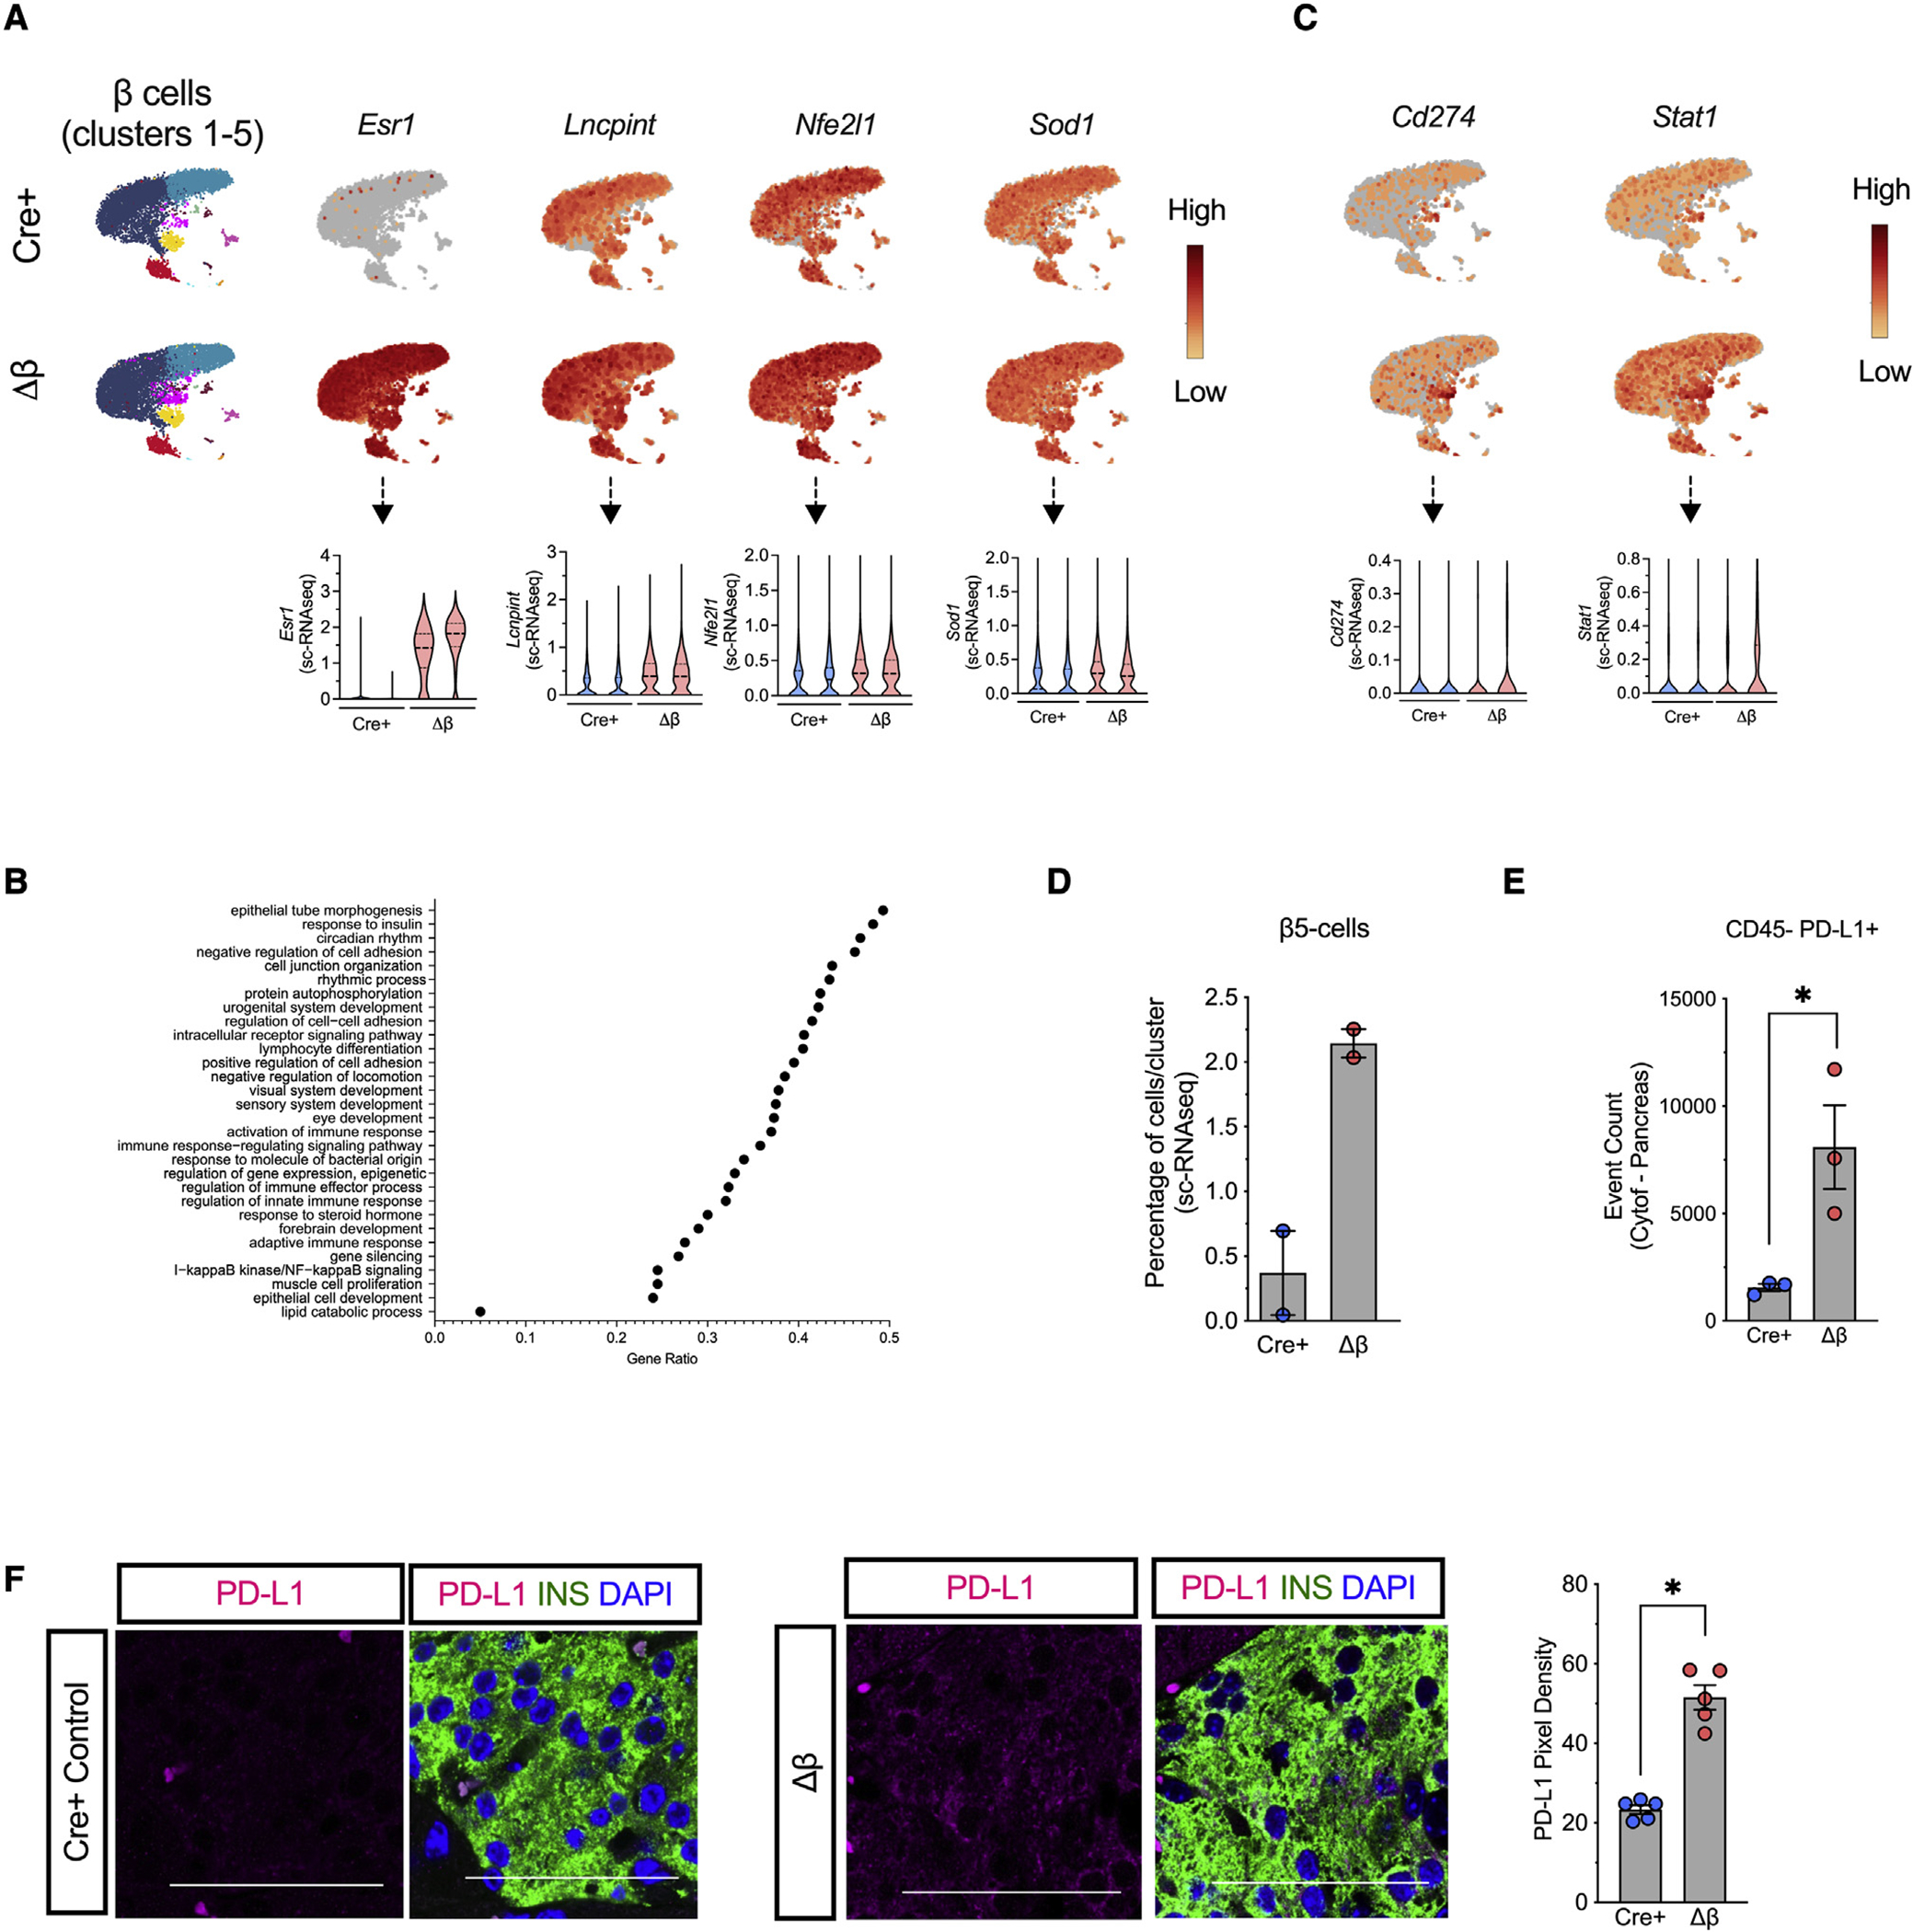
Figure 5. β cell deletion of Alox15 enhances expression of the immune checkpoint protein PD-L1.

Islets were isolated from NOD-Cre+ and NOD-Δβ mice at 8 weeks of age, dissociated into single cells, and subjected to single-cell RNA sequencing. N = 2 individual animal replicates.
(A) UMAP gene expression patterns and violin plots of Esr1, Lncpint, Nfe2l1, Sod1, and Cd74 in the 5 β cell clusters (clusters 1–5; FDR < 0.05).
(B) UMAP gene-expression patterns and violin plots of Cd274 and Stat1 in the 5 β cell clusters (clusters 1–5; FDR < 0.05).
(C) Gene ontology-gene set enrichment analysis (GO-GSEA) in the 5 β cell clusters (clusters 1–5).
(D) Percentage of cells in β cell cluster 5.
(E) Number of non-immune cells (CD45-) expressing PD-L1 as measured by mass cytometry of the pancreas.
(F) Representative images of pancreata from 8-week-old mice immunostained for PD-L1 (magenta), β cells (insulin, green), and nuclei (DAPI, blue), and quantification of PD-L1 pixel density from islets (from N = 5 mice). Scale bars, 50 μm. Data are expressed as the mean ± SEM. *p < 0.05.
