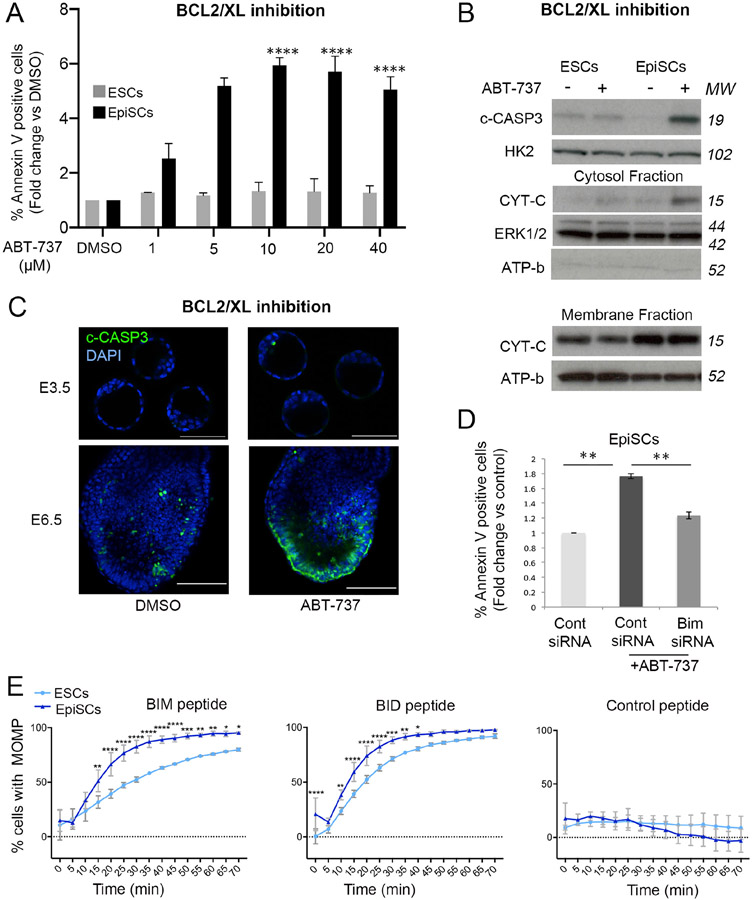
Figure 2. Enhanced activation of the mitochondrial apoptotic pathway in primed pluripotent cells.
Apoptosis quantified as % Annexin V positive ESCs and EpiSCs treated for 24h with increasing concentrations of ABT-737. Fold change versus DMSO treated cells is shown. B. Cleaved-CASPASE 3 (c-CASP3) levels relative to HEXOKINASE 2 (HK2) in ESCs and EpiSCs treated for 24h with 5μM ABT-737. CYTOCHROME C (CYT-C) levels in the cytosolic and membrane fractions in ESCs and EpiSCs treated with 5μM ABT-737 for 24h relative to ERK1/2 and ATP-b. C. Cleaved-CASPASE 3 immunostaining in E3.5 and E6.5 embryos treated with DMSO (E3.5 n= 3; E6.5 n=5) or 2μM ABT-737 (E3.5 n= 3; E6.5 n=5) for 1.5h. Scale bar E3.5=50 μm; E6.5=100μm. D. Fold change in % Annexin V positive EpiSCs transfected with control siRNA or Bim siRNA and treated with DMSO or 5μM ABT-737 for 24h. E. % membrane depolarization in ESCs and EpiSCs treated with either the BIM (10μM), BID (10μM) or control (10μM) peptides for the indicated amounts of time. Average of 3 (A, E) or 4 (B) experiments +/−SEM (D) or +/−SD (E) is shown. (D) Student T-Test or (A) 2-way ANOVA with Šidák correction *p<0.05, **p<0.01 or ****<0.00001. MW= Molecular weight. See also Figure S1.

