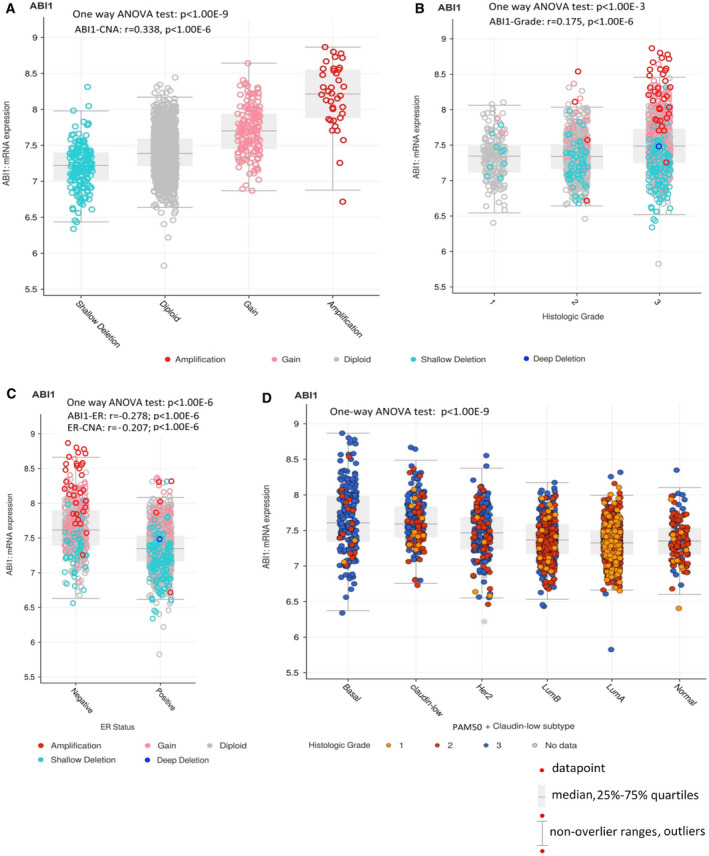
Fig. 1.

ABI1 expression alteration is associated with copy number alteration (CNA) and high‐aggressive basal‐like breast cancer. Box Plots: (A) Putative ABI1 DNA copy number alteration (CNA) drives ABI1 transcription level in subpopulations of primary breast cancer patients [42]. The gene expression, CNA, tumor samples, and clinical datasets representing 1904 primary breast cancer samples were downloaded from METABRIC dataset (https://www.cbioportal.org/). CNA categorization is the following: shallow deletion: 1 (n = 166), diploid: 2 (n = 1554), gain: 3 (146), and amplification: 4 (n = 38). One‐way ANOVA test (Statistica 13) showed significant differences in the ABI1 expression between the groups and also in the entire cohort (P < 1.00E‐9). Furthermore, the transcription level of ABI1 is highly significant and positively correlated with CNA ((r = 0.338; P < 1.00E‐6; estimated by Spearman). (B) ABI1 transcription level positively correlated with histologic grades (univariate and bivariate linear regression models testing shown significance at P < 1.00E‐6), however (C) negatively correlated with ER status. Bivariate linear regression models (Statistica 13) showed that both expression ABI1 expression level and CNA are significant (r = −0.278; P < 1.0.00E‐6 and r = −0.207, P < 1.00E‐6 respectively); however, the ABI1 expression provides a major contribution in the bivariate linear regression function). Correlate coefficients in (B) and (C) were calculated by Kendall. (D) ABI1 overexpression is associated with basal‐like and claudin‐low breast cancer subtypes and aggressiveness of breast cancer scoring also by histologic grade. PAM50 (Basal‐like, HER2(+), luminal B, luminal A, normal‐like), and claudin‐low subtypes were ranked‐order according to the trend of decreasing of ABI1 expression. One‐way ANOVA test (Statistica 13) showed significant differences in the ABI1 expression between basal‐like, claudin‐low subtypes and other subtypes (P < 1.00E‐6). ABI1 expression in the HER2 subtype was significantly higher than in luminal B or luminal A tumor subtypes (P < 1.00E‐6) and higher but less significant than in the normal‐like tumor subtype (P = 001). A negative trend in the ABI1 expression across rank‐ordered tumor subtypes was mostly defined by relative overexpression of Basal‐like and claudin‐low tumor subtypes; it was highly significant (one‐way ANOVA; P < 1.00E‐9; Statistica 13).
