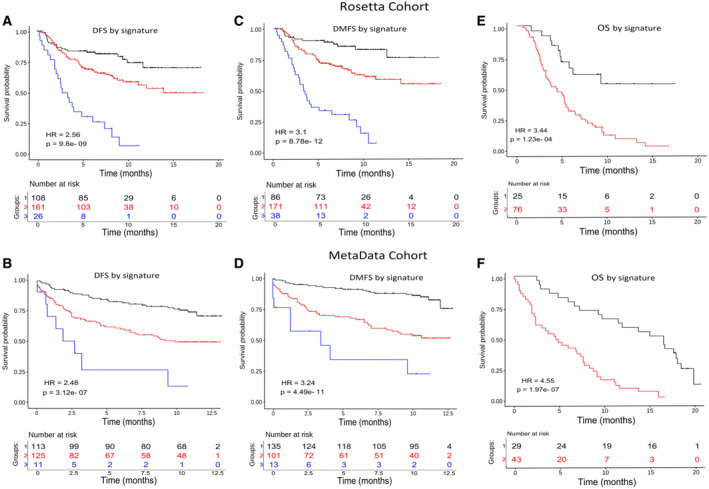
Fig. 2.

ABI1‐based prognostic signature predicts disease‐free and metastatic‐free survival risks. The disease‐free survival (DFS) and disease metastasis‐free survival (DMFS) of patients stratified based on the ABI1‐associated signature derived by our survival prognostic analysis method (see Methods for details) is shown using Kaplan–Meier survival curves for Rosetta (A, C) and MetaData cohorts (B, D). The Wald statistic P‐value and hazard ratio (HR) associated with the partitioning of the patients into distinct risk groups are also shown (see methods for details). Our method computationally categorizes each covariate (expression level of a gene) as a binarizing risk factor and stratifies each patient according to the multivariate expression pattern of the genes included in the signature (Table S1). In panels A, B, C, and D: black color line = ‘low‐risk’, red = ‘intermediate risk’, blue = ‘high‐risk’ groups. Panels E and F represent the overall survival (OS) time functions for the patients with metastasis detected after diagnostic and following surgical treatment. The black color line is associated with the group of patients with relatively better disease outcomes, while the red color is associated with patients with poor disease outcomes. The tables at the bottom of plots show the number of patients who survived in the predicted groups more than the given time point.
