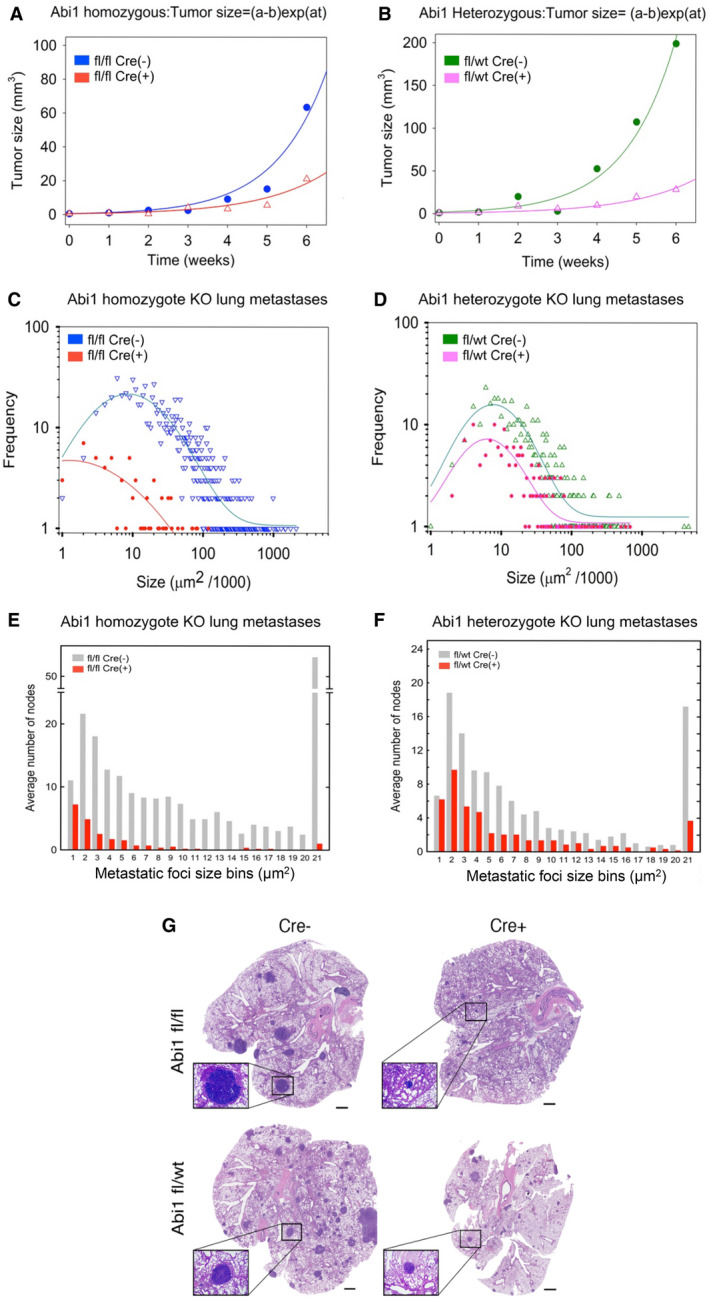
Fig. 6.

Abi1 gene knockout reduces metastatic burden in heterozygous and homozygous mice. Representative tumor kinetics of primary (panels a‐b) vs metastatic tumors (panels c‐d). Panel (A) Comparison of the primary tumor volume kinetics in Abi1 homozygous KO mouse (fl/fl; Cre+) (G209, data: red triangle; best‐fit function: red line) and the control Abi1 (fl/fl Cre‐) mouse (G184, data: blue circle; best‐fit function: blue line). (B) Comparison of the primary tumor kinetics of Abi1 KO heterozygous (fl/wt Cre+) mouse (G251, data: pink triangle; best‐fit function: pink line) and the Abi1 control (fl/wt; Cre‐) mouse (G202, data: green circle; best‐fit function: green line). Kinetics of mean values (A and B) were fitted by exponential curve f (t; a, b) = (a − b) * exp(at), where t is time, constant a is the rate of cell population growth and constant (a − b) is the initial tumor population size. Each kinetic dataset includes seven time points (see also Table S10). The estimated parameters in Abi1 fl/fl Cre (‐) tumors: a = 0.77 +/− 0.159, t‐test, P = 0.0047, b = 0.2 +/− 0.678, t‐test, P > 0.1 and in Abi1 fl/fl Cre (+) a = 0.60 +/− 0.153, t‐test, P = 0.0039), b = 0.1 +/− 0.586, t‐test, P > 0.1. Estimated parameters in Abi1 fl/wt Cre (‐) tumors: a = 0.79 +/− 0.091, t‐test, P = 0.001), b =−1.00 +/− 0.964, t‐test, P > 0.1, and in Abi1 fl/wt Cre (+) a = 0.589 +/− 0.110, t‐test, P = 0.0031, b =−0.30 +/− 0.66, t‐test, P > 0.1. According to these results, differences between mean values of the tumor sizes in the studied groups in time are not significant. While primary tumor volume kinetics was not significantly different in these mice vs. their corresponding controls, (A, homozygous ABI1 KO vs. control) and (B, heterozygous KO vs. control), the difference in metastatic tumor burden of the same mice within each mouse genotype was significant (C) and (D). Panels (C) and (D) show the frequency distributions of a lung metastatic foci size in the heterozygous and homozygous mice, which primary tumors kinetics showed on panels (A) and (B), respectively. Each Y‐axis value shown in the histograms (C‐D) represents a count of metastatic foci within a metastatic size normalized interval (a bin). The bin was defined by rounding the metastatic size divided by 1000 to the nearest integer, and the number of metastatic foci in each bin was counted. Based on our findings, the metastases size frequency distribution in the lung has skewed form with the long right tail. To provide a visualization of such frequency distribution, we used log10 − log10 plot. We used the same color for dots of the empirical distributions and the fitting function lines, as was indicated in the figures. Such empirical frequency distribution was modeled and parameterized using the shifted log‐normal distribution function: where x is the node size and y 0, x 0, a, b unknown parameters. We estimated the parameters using the nonlinear curve fitting option of SigmaPlot‐13 software. Datasets and detailed results of the parameterization of this function are presented in Table S9. (E‐F) show histogram bar plots for the distribution of the average number of metastases foci size in the lungs of Abi1 KO mice in comparison to their genetic controls. X‐axis indicates binning for every 5000 μm2 metastasis colony area size, with bin 1 representing 0–5000 μm2 and bin 21 representing 100001 μm2 and larger; Y‐axis: count of the samples within given binning interval (+/− SEM). The size stratification of individual metastatic colonies shows that mice lacking ABI1 still have relatively small metastatic colonies but they grow slowly or/and stay at dormant state and appear unable to establish macrometastases when compared to our controls (P < 0.001; Wilcoxon signed‐rank test). Lung metastasis quantification was performed following fixation, paraffin embedding and sectioning: three 5μm sections (sectioned every 50μm) were collected from each mouse (Abi1 fl/fl, Cre‐, n = 7; Abi1 fl/fl, Cre+, n = 6; Abi1 fl/wt, Cre‐, n = 6; Abi1 fl/wt, Cre+, n = 6; animals per genotype, age 18–22 weeks), were stained with hematoxylin and eosin, and imaged using Omnyx digital pathology scanner (GE Healthcare). Images were quantified using ImageJ software (NIH). Results of panels (E) and (F) support the results presented in (C) and (D). (G) Histological staining of representative lung sections reveals severely diminished metastasis upon deletion of the Abi1 gene. Scale bar, 1 mm. Inset, 4× magnification.
