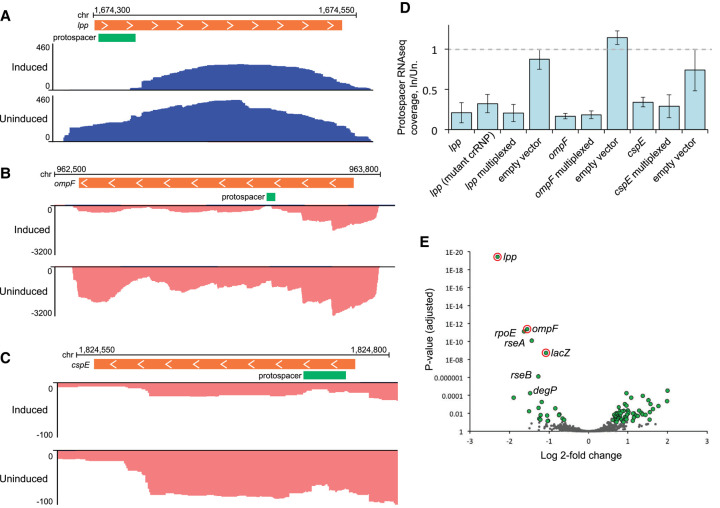
FIGURE 6.
RNA-seq analysis of transcript abundance after expression of type III-A crRNPs. (A–C) Genome browser tracks show stranded total RNA-seq read density over selected regions of the host (E. coli) chromosome. RNA-seq reads aligned to the top strand are colored blue; bottom strand reads are pink. Orange bars show the position of ORFs for targeted genes; green bars show the position of the programmed protospacer for each gene. The x-axis indicates cumulative read depth. Inducing type III-A crRNP expression led to a reduction in read density for the targets lpp (A), ompF (B), and cspE (C). All three replicates were similar; representative replicates are shown. (D) To quantify the reduction in RNA-seq read density at the target site, all reads overlapping the protospacer position were counted. The counts for the induced replicates are shown as a proportion of the average counts for the uninduced replicates. The mutant crRNP lacked the csm6 gene and contained HD and Palm active site mutations in Csm1. (E) Genome wide differences in RNA expression were determined for a type III-A crRNP programmed to target lpp, ompF, cspE, and lacZ as compared to the cspE individual target crRNP. Plots show the log2–fold change (log2fc) in transcript abundance and adjusted P-value (Padj) for each expressed gene; genes for which the Padj was less than 0.1 and log2fc was greater than 0.58 are plotted in green; genes which did not meet this threshold are in gray. The programmed targets lpp, ompF, and lacZ are circled in red. Several genes in the rpoE-rseABC regulon are labeled.

