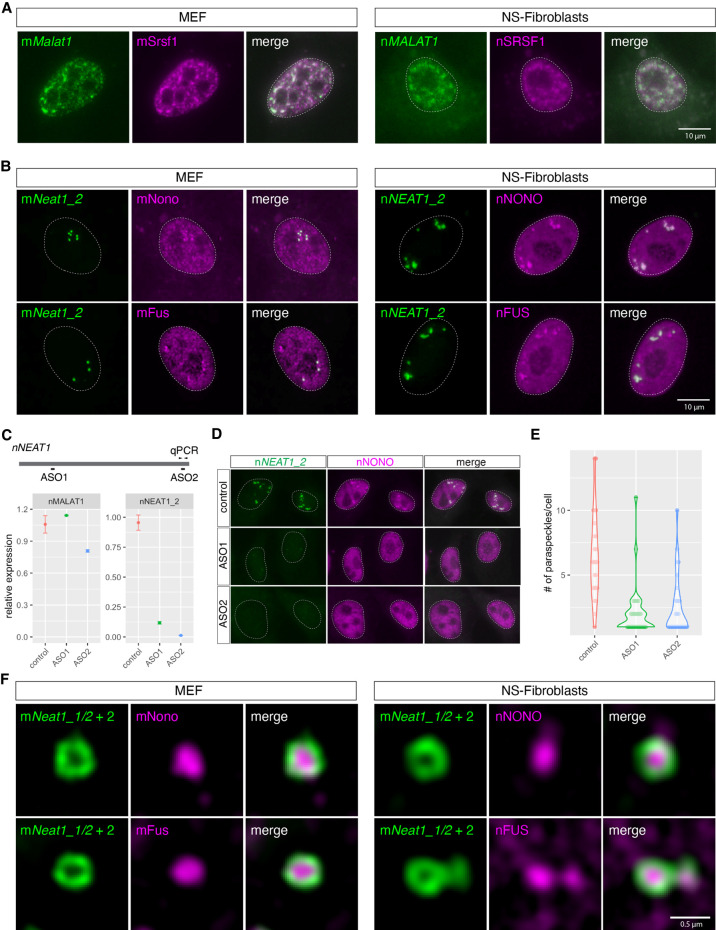
FIGURE 2.
The same subcellular distribution of mMalat1/nMALAT1 and mNeat1/nNEAT1 in MEF and NS-fibroblasts. (A) Simultaneous detection of mMalat1/nMALAT1 (green) and the nuclear speckle marker Srsf1/SRSF1 (magenta) in MEF and NS-fibroblasts. Note that both mMalat1 and nMALAT1 are enriched in nuclear speckles identified by mSrsf1/nSRSF1 expression. (B) Simultaneous detection of mNeat1_2/nNEAT1_2 (green) and the paraspeckle markers mNono/mFus and nNONO/nFUS in MEF and NS-fibroblasts, respectively. (C) Expression of nMALAT1 and nNEAT1_2 in NS-fibroblasts upon treatment of ASO. The positions of ASOs are shown in the schematic drawing. Arrowheads indicate the position of qPCR primers to detect the expression of nNEAT1_2. (D) Simultaneous detection of nNEAT1_2 (green) and nNONO (magenta) in NS-fibroblasts treated with ASOs. (E) Quantification of the number of paraspeckles in the NS-fibroblast upon knockdown of nNEAT1_2. Each dot represents the number of paraspeckles in each cell. (F) Simultaneous detection of mNeat1_2/nNEAT1_2 (green) and mNono/mFus and nNONO/nFUS (magenta) at high magnification using structural illumination microscopy. Scale bars, 10 µm in A and B and 0.5 µm in C.

