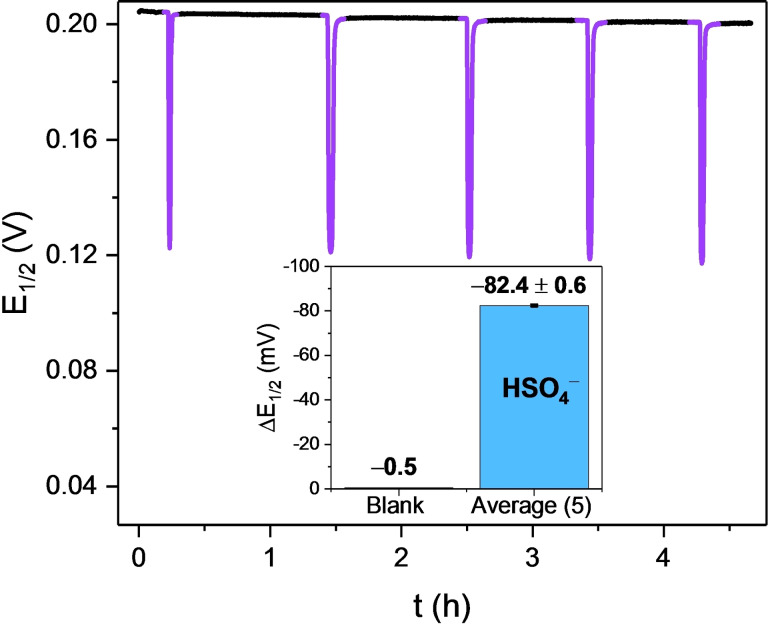
Figure 5.
Voltammetric response of 1.XBSAM towards five additions of HSO4 − under continuous electrolyte flow (flow rate=200 μL min−1) over 4.5 h. Each spike represents the response towards aliquots (V Sample=0.5 mL) of 20 mM HSO4 −. The inset shows the voltammetric shift in response to the blank sample and the average of all five HSO4 − additions. Data analysis was carried out according to the AsymFit method.

