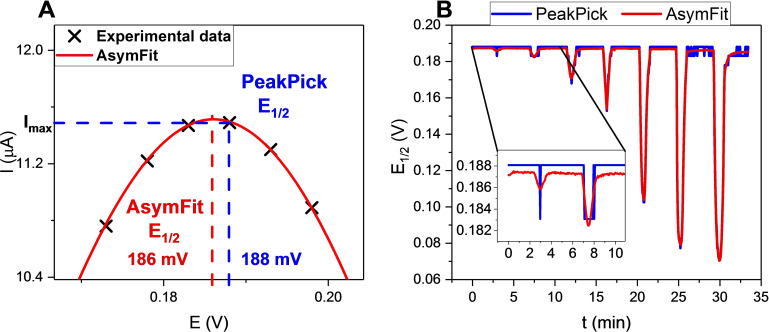
Figure 6.
A) Schematic representation of E 1/2 determination through the PeakPick and AsymFit methods. Real data points, recorded with E step=5 mV (amplitude=20 mV, frequency=50 Hz) are shown as black crosses with the fitted peak function [Eq. (S3)] shown as a red line. B) Comparison of sensograms of 1.HBSAM in response to increasing concentrations of HSO4 − (0.5–50 mM) analysed with the PeakPick (black) and AsymFit (red) methods. The inset displays a magnification for the first two additions. As depicted, the E 1/2 obtained by peak picking is significantly less accurate than that obtained by the AsymFit method.

