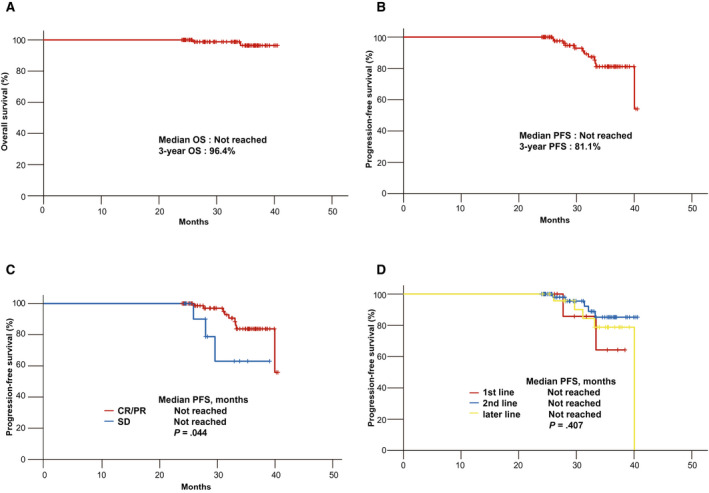
Figure 2.

Kaplan‐Meier curves of a survival analysis of patients who completed 2 years of ICI therapy: (A) OS, (B) PFS, (C) PFS according to the response to treatment, and (D) PFS according to the line of treatment. CR indicates complete response; ICI, immune checkpoint inhibitor; OS, overall survival; PFS, progression‐free survival; PR, partial response; SD, stable disease.
