
. 2021 Oct 21;39(1):90–97. doi: 10.1111/ger.12596
© 2021 The Nippon Dental University. Gerodontology published by Gerodontology Association and John Wiley & Sons Ltd.
This is an open access article under the terms of the http://creativecommons.org/licenses/by/4.0/ License, which permits use, distribution and reproduction in any medium, provided the original work is properly cited.
FIGURE 2.
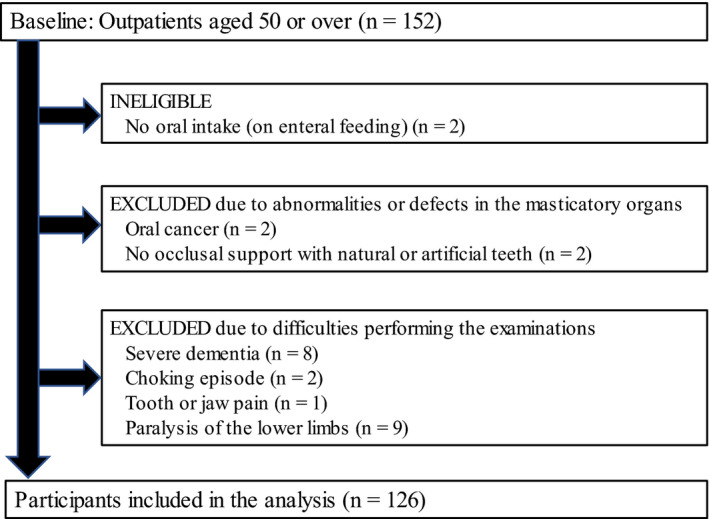
Flow chart of the participants