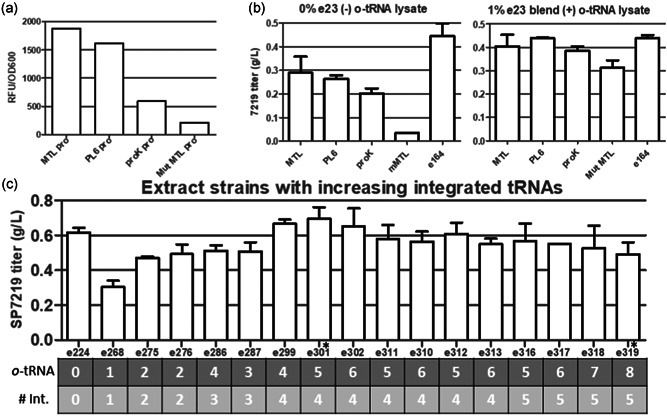
Figure 3.

Transcription of o‐tRNA from chromosome. (a) Promoter library strength was measured by plasmid‐based GFP expression from a single representative sample (b) nnAA‐IgG titers from extracts with a single integrated tRNA cassette with various promoters. On the left panel, all amber suppressor tRNA is supplied by the extract. The right panel shows reactions supplemented with tRNA using an o‐tRNA reagent lysate e23. E164 is a batch extract with o‐tRNA transcription from a plasmid. (c) Optimization of the number of chromosomal integrations and integrated o‐tRNAs; nnAA IgG produced in CF with extract from cells with increasing number of integrated o‐tRNAs. E224 is a continuously fermented extract with o‐tRNA transcription from a plasmid. Data in (b) and (c) is from two titer measurements from two independent batches of extract. Error bars show 1 standard deviation. nnAA IgG titers from extracts e299 and e319 are significantly different with p < 0.01. CF, cell free; nnAA, nonnatural amino acids
