FIGURE 2.

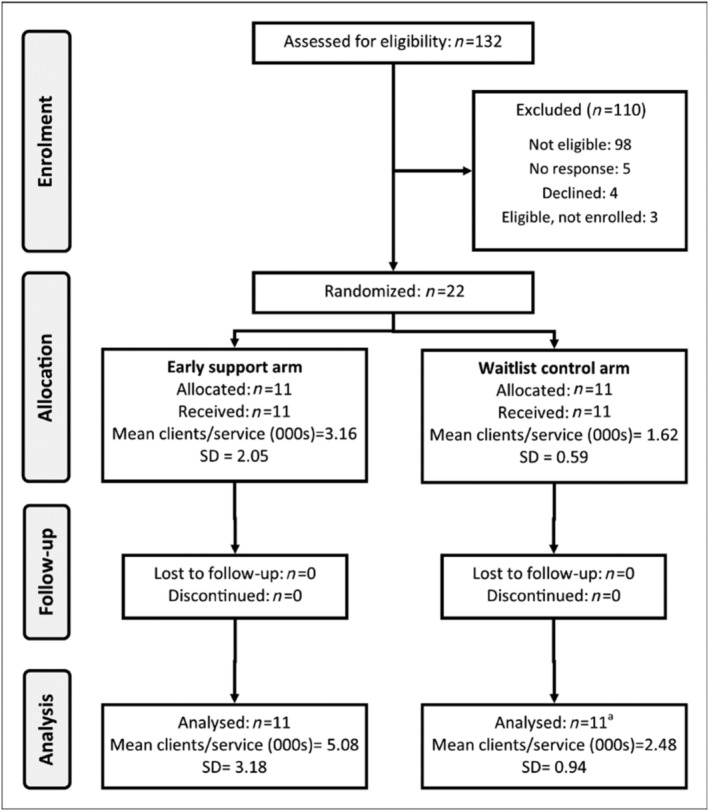
Flow diagram of participating services (n = number of services). aOne service was unable to provide data from January 2019 onwards as they stopped using Communicare to log AUDIT‐C results. Duration of follow‐up was 24 months

Flow diagram of participating services (n = number of services). aOne service was unable to provide data from January 2019 onwards as they stopped using Communicare to log AUDIT‐C results. Duration of follow‐up was 24 months