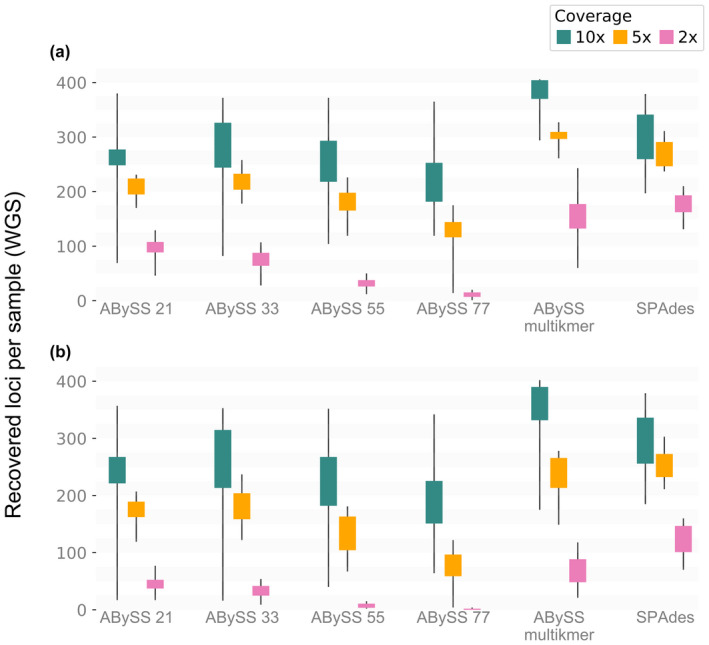
FIGURE 4.

Boxplot of the median recovered loci per sample for each assembly strategy for the three subsets of different average coverages (10×, 5× and 2×). (a) Unprocessed data, without the exclusion of sequences with more than 50% missing information – Ns. (b) Processed data (when sequences with more than 50% missing information ‐ Ns ‐ are excluded). Different colours represent the different average depths of coverage for the WGS data sets
