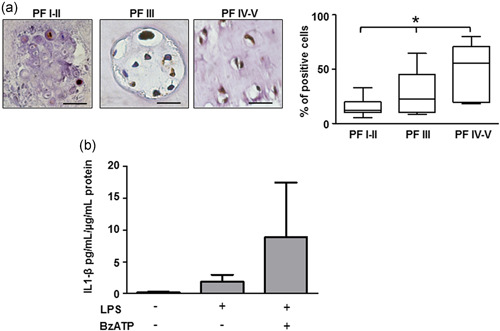
Figure 4.

IL1‐β in intervertebral disc. (a) Immunohistochemical analysis of IL‐1β was performed on IVD tissues at different Pfirrmann (PF) grades. Quantification was also reported and expressed as % of positive cells per area (3–5 sections per sample; PF I–II group, n = 7; PF III group, n = 7; PF IV–V group, n = 8). *p < 0.01 (PF IV–V group vs. PF I–II group and PF III group vs. PF I–II). Scale bars = 20 µm. (b) IL‐1β release by IVD cells after treatment with 500 µM BzATP in the presence of 10 µg/ml LPS. Data are presented as average mean ± SEM. Data were evaluated by ANOVA followed by Tukey test, p > 0.05 (n = 3). ANOVA, analysis of variance; IL‐1β, interleukin‐1β; IVD, intervertebral disc; LPS, lipopolysaccharide
