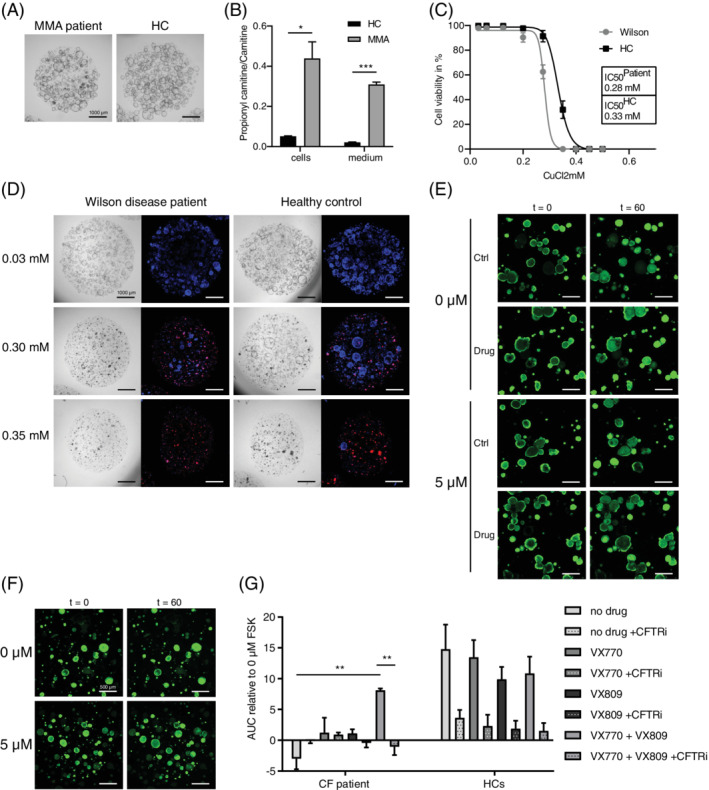
FIGURE 2.

Functional assays revealing disease phenotypes in patient ICOs. (A) Representative culture of MMA patient and HC ICOs under EM. (B) Branched‐chain amino acid metabolism defect exemplified by significantly increased propionylcarnitine to carnitine ratio in ICOs of an MMA patient (n = 2; *, P‐value = .0221 in cells; ***, P‐value = .0009 in medium). (C) Copper metabolism defect exemplified by increased sensitivity to copper (CuCl2) toxicity in ICOs of a Wilson disease patient compared to a HC after 72 hours of exposure (n = 12). (D) Brightfield and IF images of the viability assay in C. showing key concentrations of CuCl2. Red signal corresponds to necrosis marker propidium iodide; blue signal indicates DNA. (E‐G) Impaired apical transport can be studied in ICOs as exemplified by defect and rescued CFTR function (***, P‐value <.0001) in ICOs of a Cystic fibrosis patient. (E,F) Representative images of CF patient (E) and HC (F) ICO swelling. (G) AUC of CF patient (n = 3) and HC (n = 6) ICO swelling with or without the drugs VX809 and VX‐770 (**, P‐value <.0031) and with or without CFTR inhibitor (**, P‐value <.0028) at 5 μM FSK relative to 0 μM FSK. AUC, area under the curve; CF, cystic fibrosis; EM, expansion condition; FSK, forskolin; HC, healthy control
