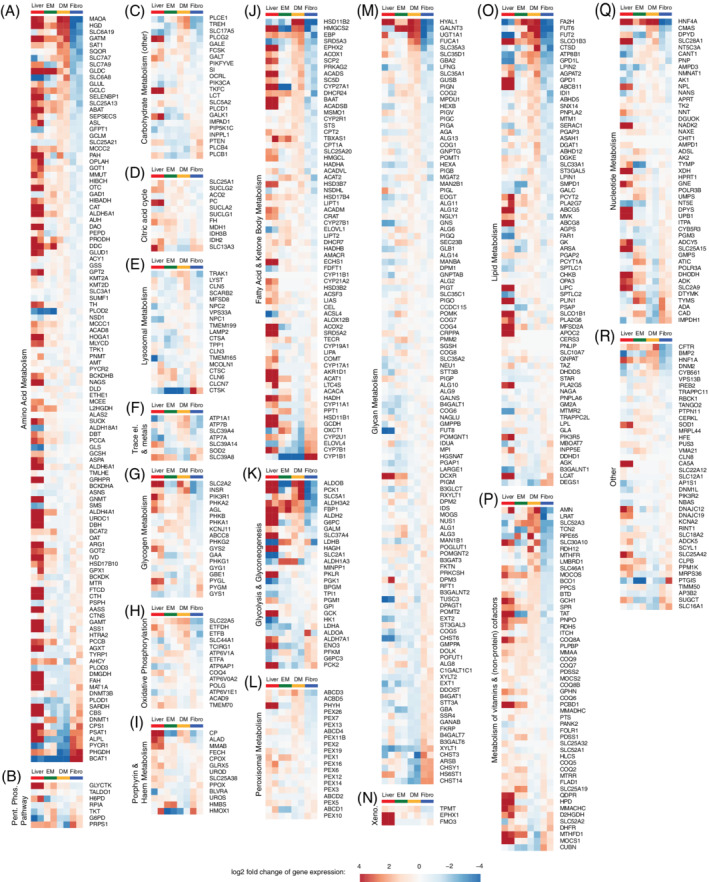
FIGURE 3.

Visualizations of log2 fold changes in gene expression of IEM genes in expanded (EM, n = 2) and differentiated (DM, n = 2) ICOs, fibroblasts (Fibro, n = 2) and whole liver tissue (n = 2). log2 fold changes are relative to the mean expression of the genes across all fibroblast and ICO DM samples. IEM genes are divided into metabolic categories Amino Acid Metabolism (A), Pentose Phosphate Pathway (B), Carbohydrate Metabolism (other) (C), Citric acid cycle (D), Lysosomal Metabolism (E), Trace element and Metal Metabolism (F), Glycogen Metabolism (G), Oxidative Phosphorylation (H), Porphyrin and Haem Metabolism (I), Fatty Acid and Ketone Body Metabolism (J), Glycolysis and Glyconeogenesis (K), Peroxisomal Metabolism (L), Glycan Metabolism (M), Xenobiotics Metabolism (N), Lipid Metabolism (O), Metabolism of vitamins and (nonprotein) cofactors (P), Nucleotide Metabolism (Q), Other (R)
