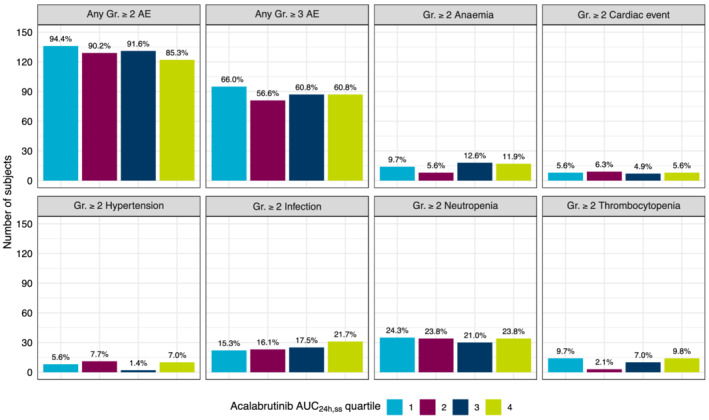
FIGURE 5.

Adverse events of clinical interest by acalabrutinib AUC24h,ss quartiles. Bars represent number of patients, and the percentage of patients in each group is calculated from the total number of patients within the quartile and noted above the bars. AE, adverse event; AUC24h,ss, area under the concentration–time curve at steady‐state conditions for a 24‐hour dosing interval; Gr, grade
