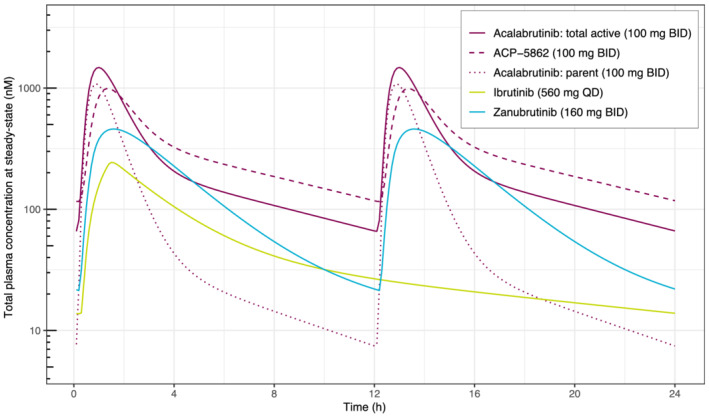
FIGURE 6.

Plasma concentration–time profiles for BTK inhibitors. PK profiles were simulated using reported population PK models for acalabrutinib, ACP‐5862 and the total active moiety, 13 ibrutinib 17 and zanubrutinib. 18 Total simulated drug concentrations are shown, not adjusting for differences in protein binding or BTK potency between substrates. BID, twice daily; BTK, Bruton tyrosine kinase; PK, pharmacokinetic; QD, once daily
