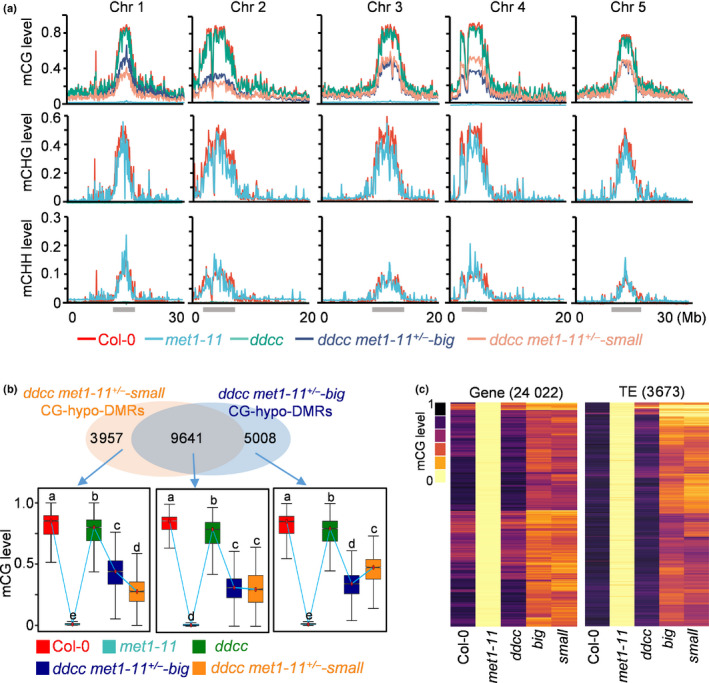
Fig. 4.

Size divergence of Arabidopsis ddcc met1+/− mutants is not caused by a difference in DNA methylation. (a) Fractional DNA methylation levels of cytosines in CG, CHG and CHH contexts across five chromosomes (Chr). The locations of pericentromeric heterochromatin are indicated with grey bars. (b) Venn diagram showing the number of CG‐hypo‐DMRs that overlap between the ‘big’ and ‘small’ plants of ddcc met1‐11+/− . Box plots show the methylation levels of CG‐hypo‐DMRs. Dark horizontal line, median; edges of boxes, 25th (bottom) and 75th (top) percentiles; whiskers, minimum and maximum percentage of DNA methylation. Significant differences between two genotypes are marked with different letters (P < 10−15, Mann–Whitney U‐test). (c) Heat map showing CG methylation levels in different genotypes at CG‐hypo‐DMRs identified in met1‐11. big: ddcc met1‐11+/−‐big; small: ddcc met1‐11+/−‐small. The number of CG‐hypo‐DMRs is shown at the top of the graph. DMR, differentially methylated region; TE, transposable element.
