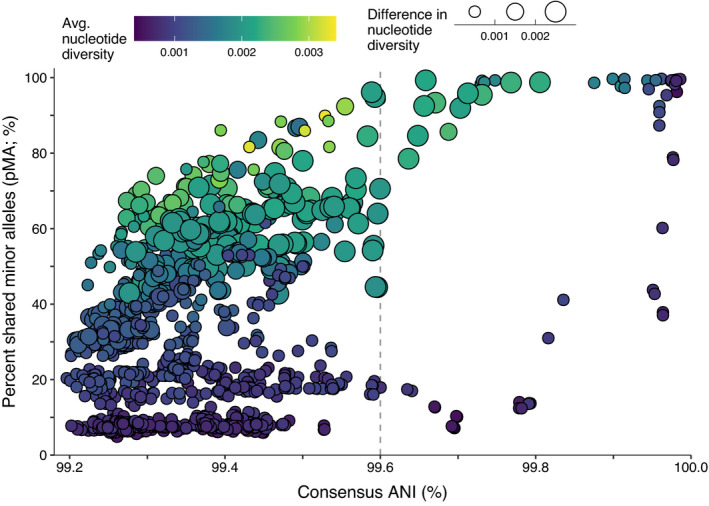
FIGURE 5.

Mean consensus ANI and the percentage of shared minor alleles (pMA) between Microcoleus sp. 1 genomes. Points are coloured by the average nucleotide identity of the two genomes. Points are sized by the absolute difference in nucleotide diversity (π) between the two genomes. Vertical dashed line shows 99.6% consensus ANI
