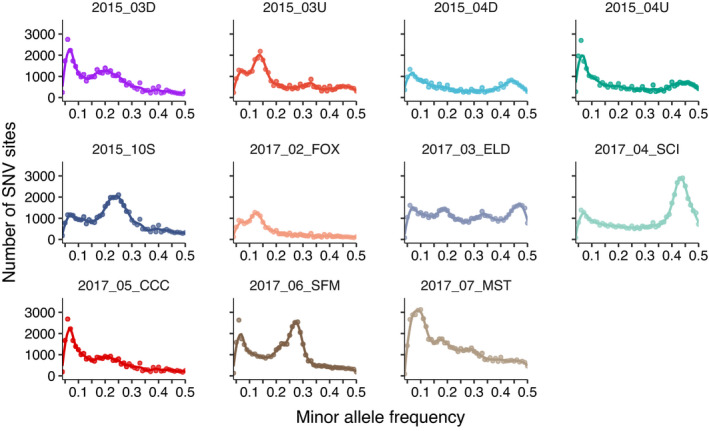
FIGURE 6.

Minor allele frequency distributions for 11 samples that have high abundances of SNV sites at frequencies >0.05 (secondary SNV peaks). The secondary peaks represent minor strains within mats that compose >5% of the mat subpopulation. Points give the number of SNV sites for a 0.02 wide frequency bin. The line is a LOESS smoothing curve to visualize the trend
