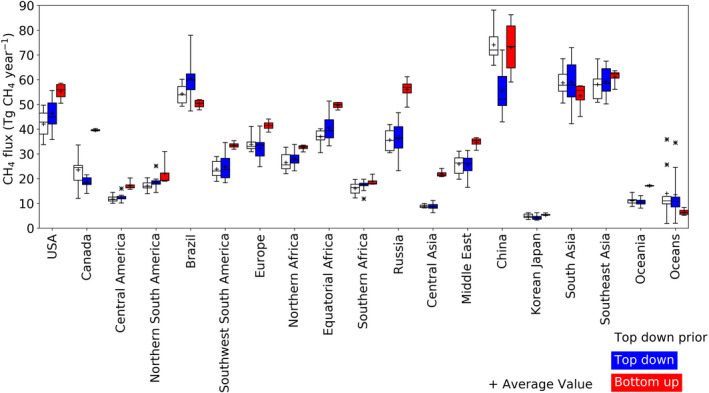
FIGURE 2.

Boxplots of the total source estimates for the most recent decade (2008–2017) for each region for the bottom‐up (BU—red boxes) and top‐down surface sites only (TD SURF—blue boxes). The priors used in the TD SURF estimate are also shown (empty boxes). The box represents the 25th to 75th percentile range, “x” represents the outliers and the whiskers show the minimum and maximum values (outliers excluded)
