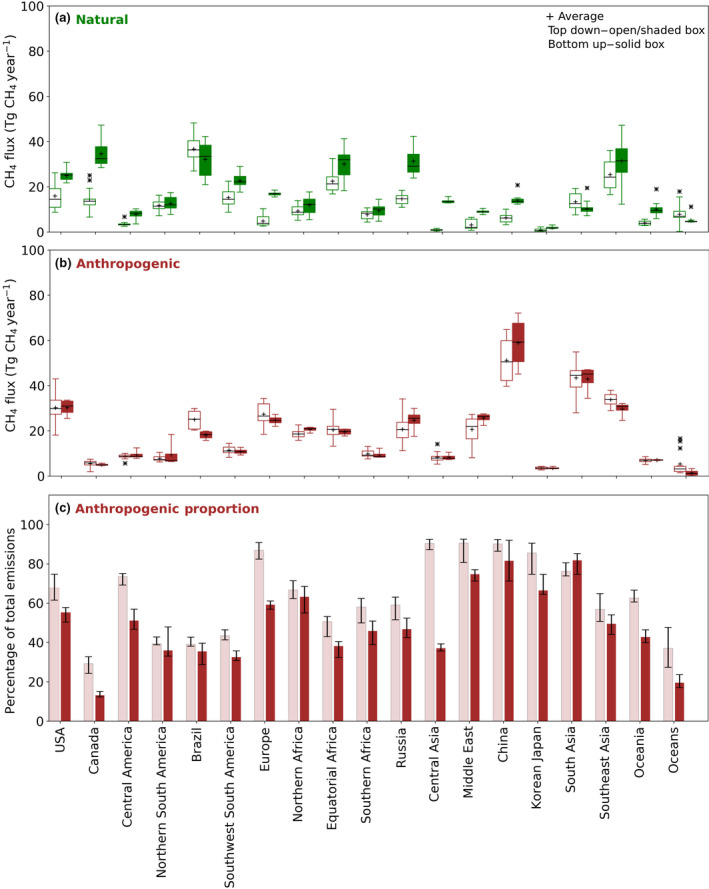
FIGURE 3.

(a) Natural (green) emissions by region, (b) mean anthropogenic (brown), and (c) mean anthropogenic proportion as a percentage of total regional emissions (brown) in Tg CH4 yr−−1 for 2008–2017. Bottom‐up (BU) estimates are shown as filled boxes and top‐down surface sites only (TD SURF) as open boxes. The box represents the 25th to 75th percentile range, “x” represents the outliers and the whiskers show the minimum and maximum values (outliers excluded)
